Lab 7 Modeling Friction Forces
Lab Members:
Jarrod Griffin
Christina Vides
Enio Rodriquez
This lab helps model kinetic and static friction forces by using a variety off different methods.
Introduction:
In this lab, we used a variety off different setups to measure static friction and kinetic friction. We also used what we had learned about friction forces to estimate the forces, and compare them to their actual values. This lab consisted of 5 different "mini" labs, so the procedures and data will be split into 5 parts.
Apparatus/Procedure
Part 1:

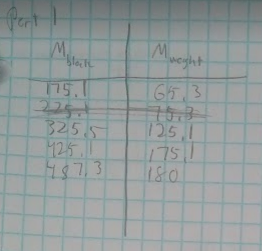
For the first part of the experiment, we used the above apparatus, and continually added mass onto the weight until the block began to move. At that point, we knew that at the mass immediately before it began to move, static friction was at its maximum. Using the mass of both the block and the weight, we could determine a value for the maximum force of static friction. We varied the mass of the block 4 times for this part.
Part 2:

For the second part of the experiment, we used the above apparatus to find a force of kinetic friction on a block. We used a force sensor, that we had calibrated, tied to a block of wood with linoleum flooring on one side, and masses that we changed on top. We varied masses 4 times. We dragged the block with the force sensor, while recording what the force sensor was reading in Logger Pro. We then graphed max kinetic friction vs Normal, and from that slope, received the coefficient of kinetic friction.
Part 3:
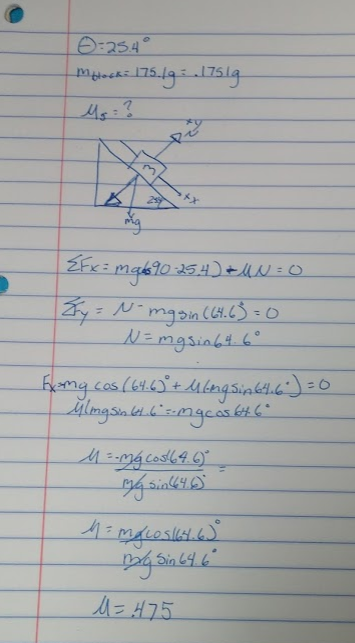
For part 3, we placed the block on a surface, and then raised the surface on one end until the block slid off. We measured the angle that the block had fallen off at using an app on our phones. From this angle, and mass of the block, we could evaluate the static friction force.
Part 4:

For part 4 of the lab, we placed a block on a sloped surface so that it will accelerate once released. We then put a motion sensor on the top of the surface, and recorded the position vs time graph in Logger Pro. We also measured the angle of the board. From these measurements, we could find a coefficient of kinetic friction.
Part 5:
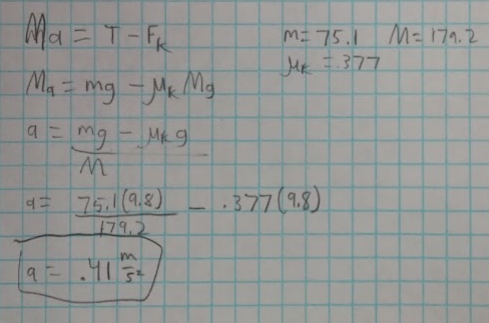
For part 5 of the lab, we set up a system as pictured above, except with a motion sensor tracking the block. We then added a mass to the weight that was heavy enough to accelerate the block. We first estimated what the acceleration would be for the block, then ran the experiment and collected data so that we could find the actual value of acceleration.
Data:
Part 1:
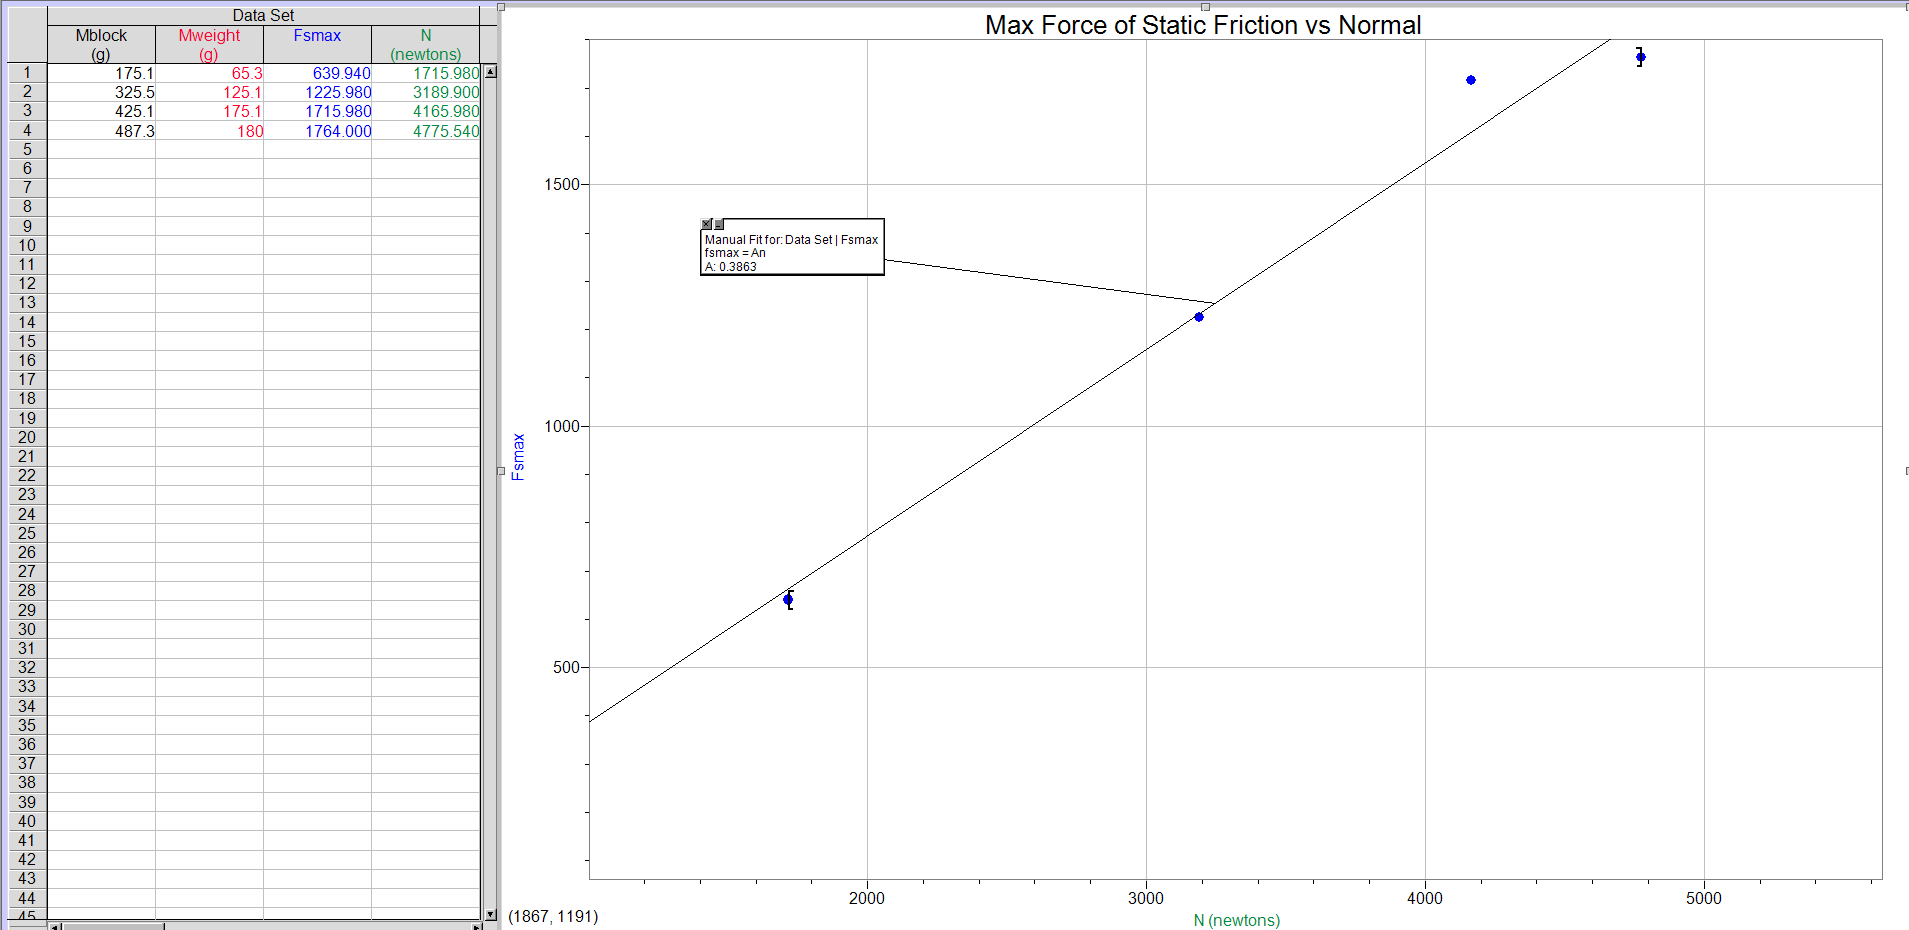
From the above graph, we take the slope to find our coefficient of static friction which for this case, is .3863.
Part 2:
For part 2, we found the force of 4 different blocks. The below graph is an example of 2 of the blocks.

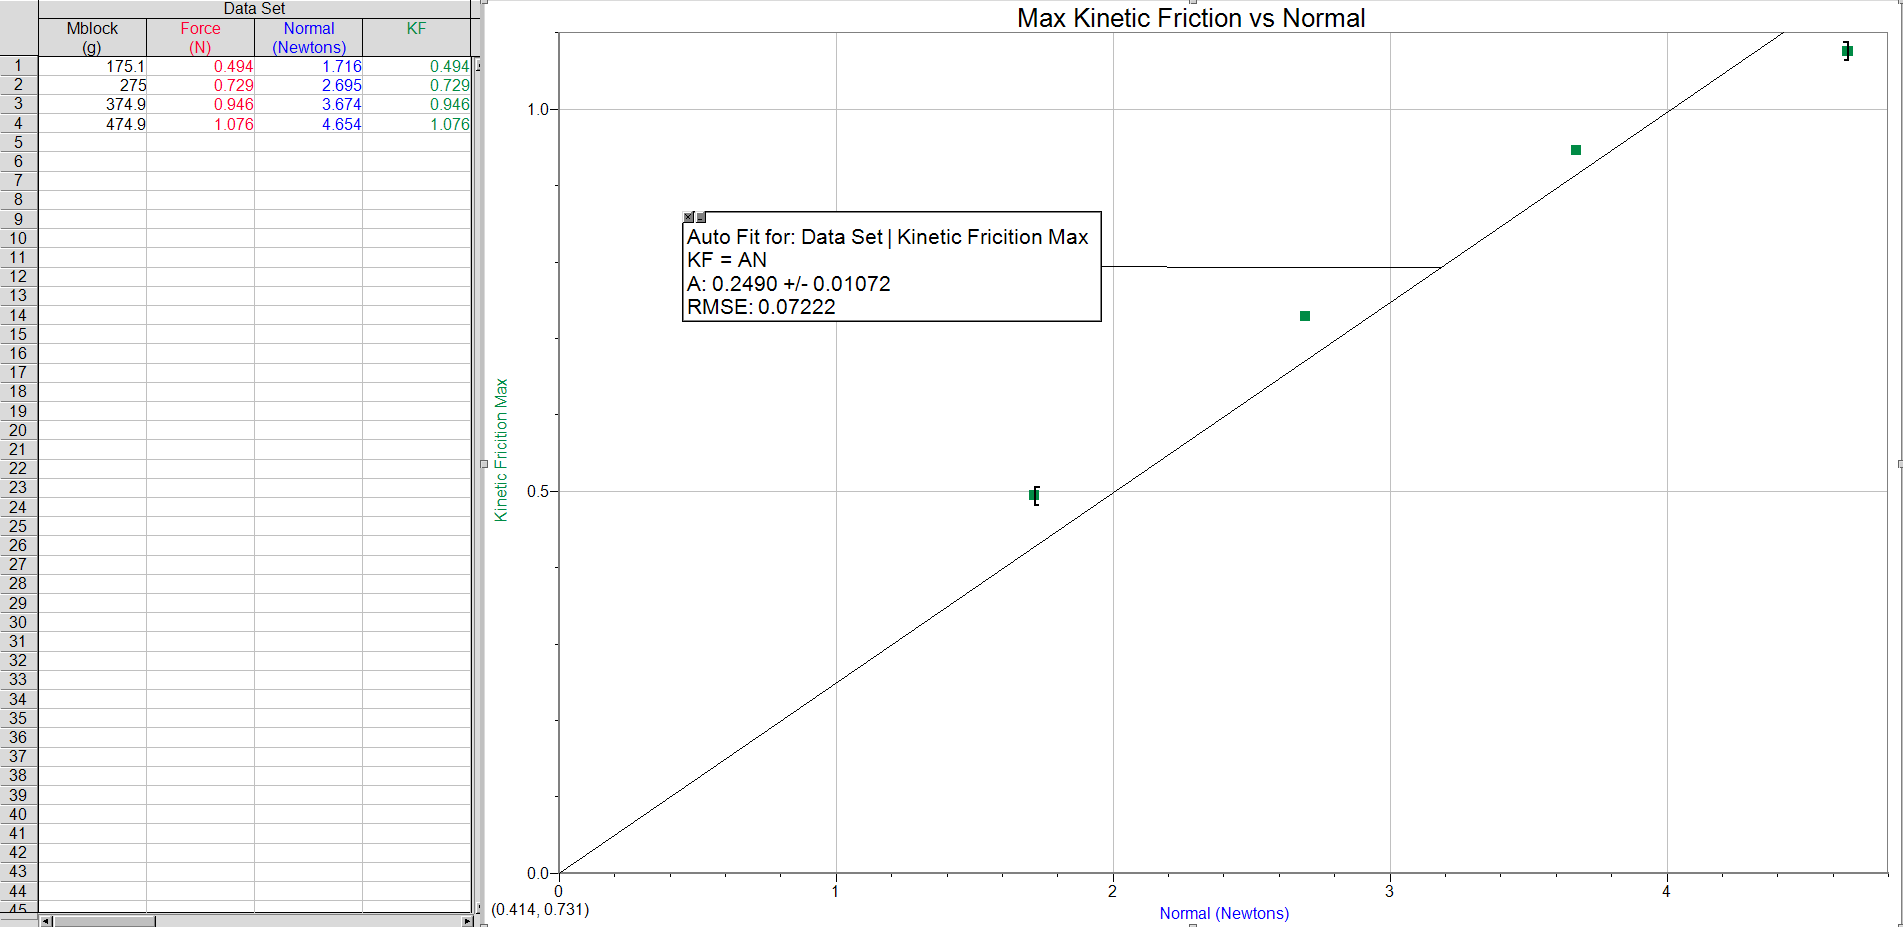
Once we had that data, we then graphed the Max Kinetic Friction vs Normal as shown below. From that, we took the slope and found the coefficient of static kinetic friction.
Part 3:
The angle of the incline for part 3 was 25.4 degrees.
Part 4:
The angle of the incline for part 4 was 20 degrees.
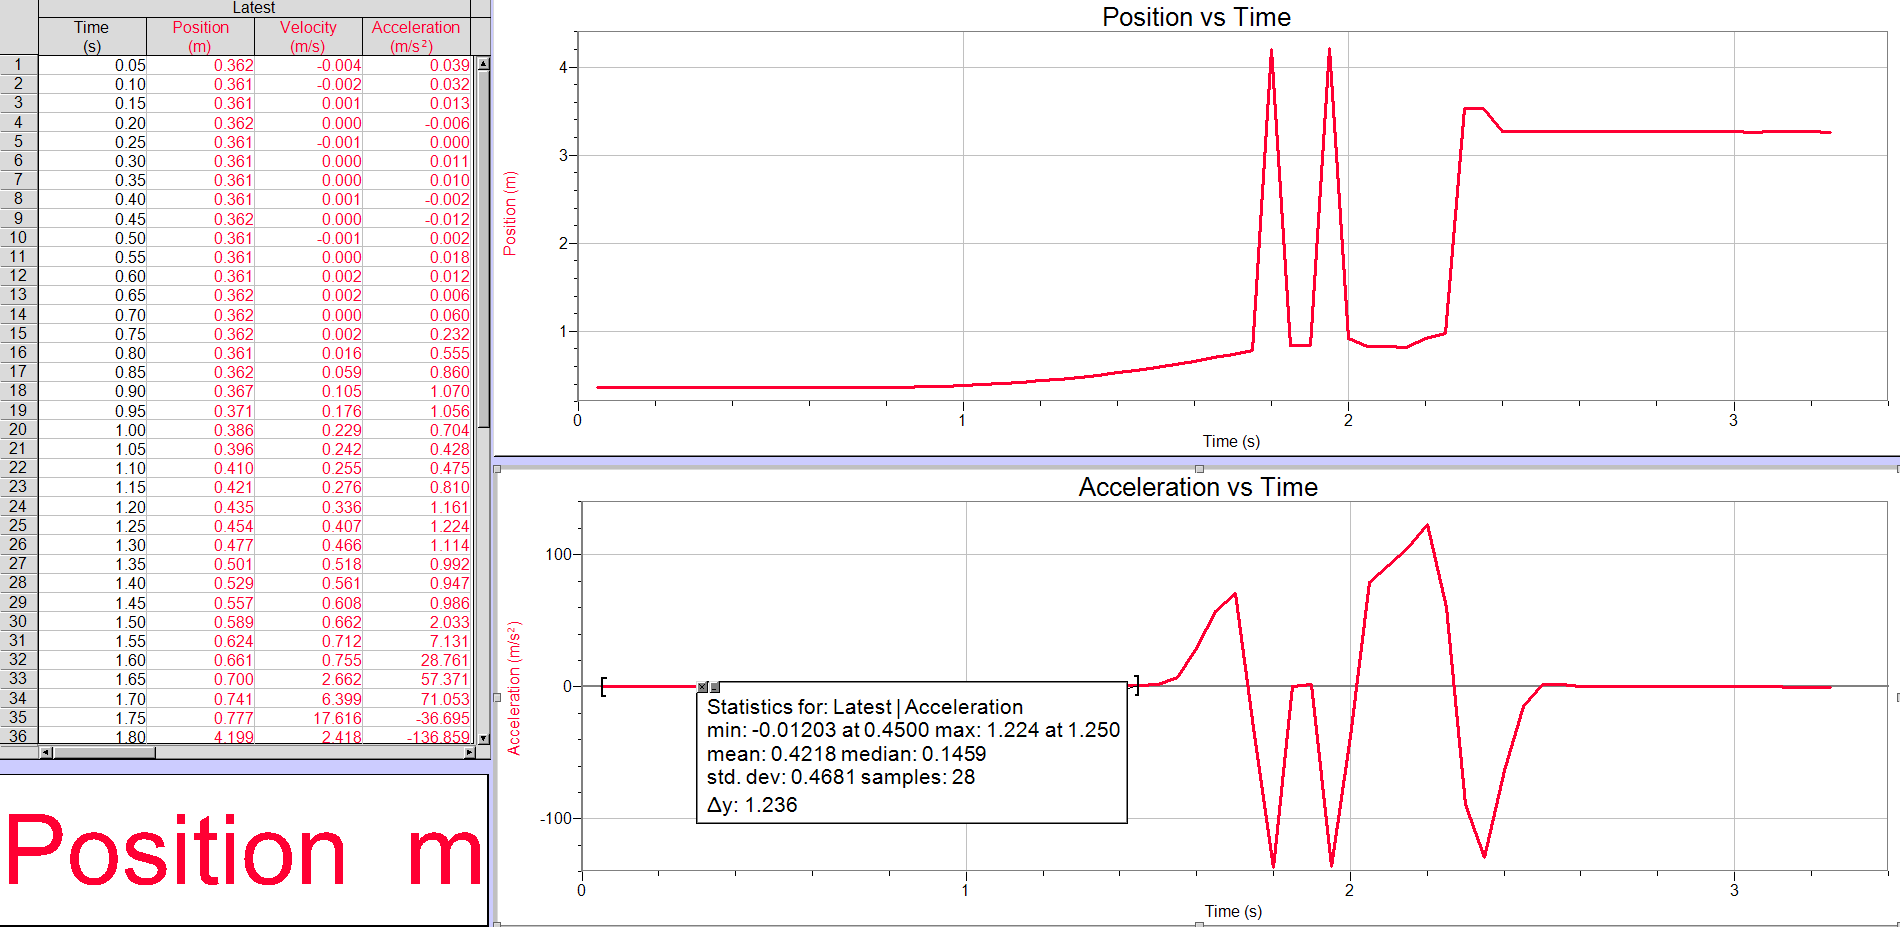
The below graph was created from the data from the motion sensor. The bottom line shows acceleration vs time.
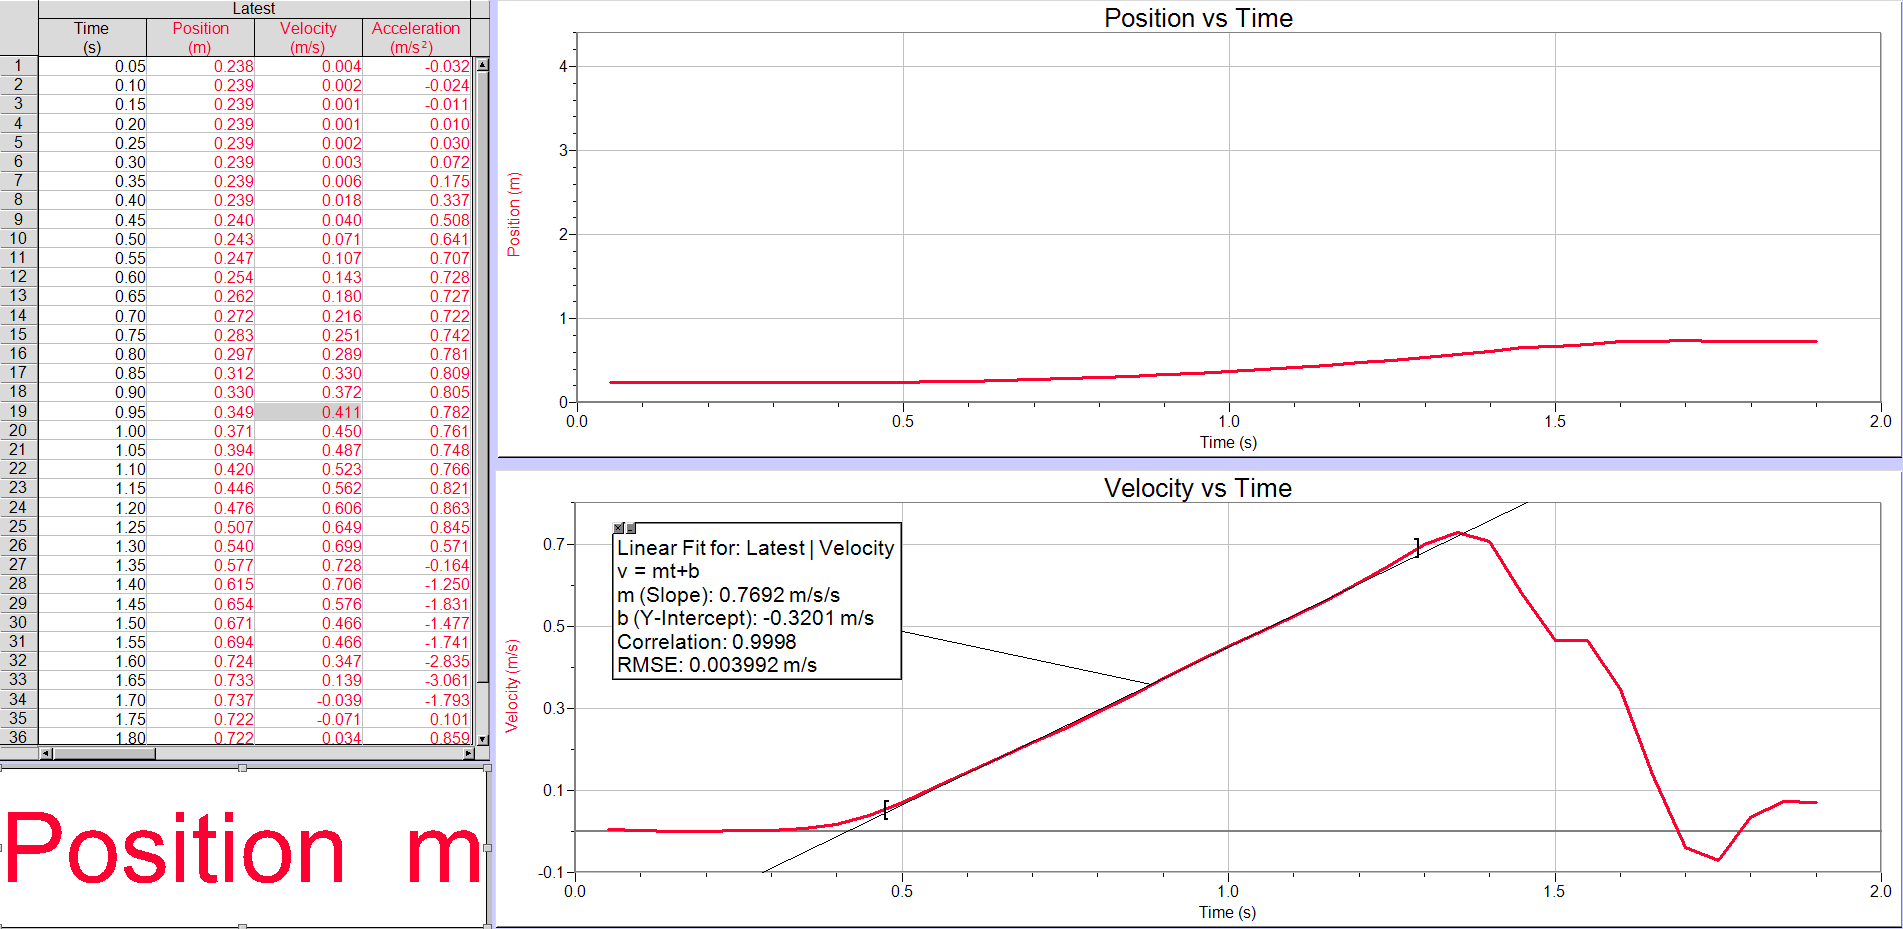
Part 5:
The below graph shows the actual acceleration of our block when attached to a weight. By finding the slope of velocity we found acceleration. Our acceleration was .7692 m/s/s.
Calculations:
Part 1:
All calculations were done by Logger Pro.
Part 2:
All calculations were done by Logger Pro.
Part 3:
Part 4:
All calculations were done by Logger Pro.
Part 5:
Conclusions:
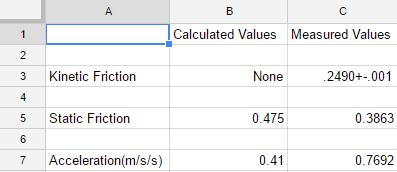
For this lab, we calculated values for both kinetic and static friction forces. We also found experimental values for both types of friction. The chart under this shows our calculated vs actual values. Our uncertainty was created by logger pro when we plugged in a fit for our data, and other inaccuracies in our equipment.
No comments:
Post a Comment