Lab 4: Modeling the fall of an object with air resistance.
Group Members: 9/14/2016
Jarrod Griffin
Christina Vides
Enio Rodriquez
In this lab, we developed a model for air resistance by dropping paper coffee filters and measuring their velocity and acceleration.
Introduction:
For this lab, we used the laptops provided, and their included webcams to take a video of falling coffee filters, with each one varying in weight. We then used the video in Logger Pro to manipulate it and find its position vs time graph. We could then get all necessary data from that graph.
Apparatus/Procedure:
The equipment need in this lab was a pack of coffee filters, a meter stick, a dark background, a tall ledge, and a laptop with camera. To collect our data we went to a building with a tall ledge from which things could be dropped from. Our professor then set up a meter stick and dark background, then dropped various amounts off coffee filters, from 1 to 6. The meter stick was required to get a distance in Logger Pro, so that it can set the scale for height. We recorded 5 different sets of filters, and then returned to class. In class we then analyzed each video in Logger Pro, to find the different velocities for the different amount of filters. Once we had this data, we calculated the average weight of 1 filter, used a model to find air resistance, and used Excel to find the terminal velocity. We did this so that different amounts of coffee filters could easily be calculated for terminal velocity. We set up Excel as described in the lab manual.
Part 1 Data:
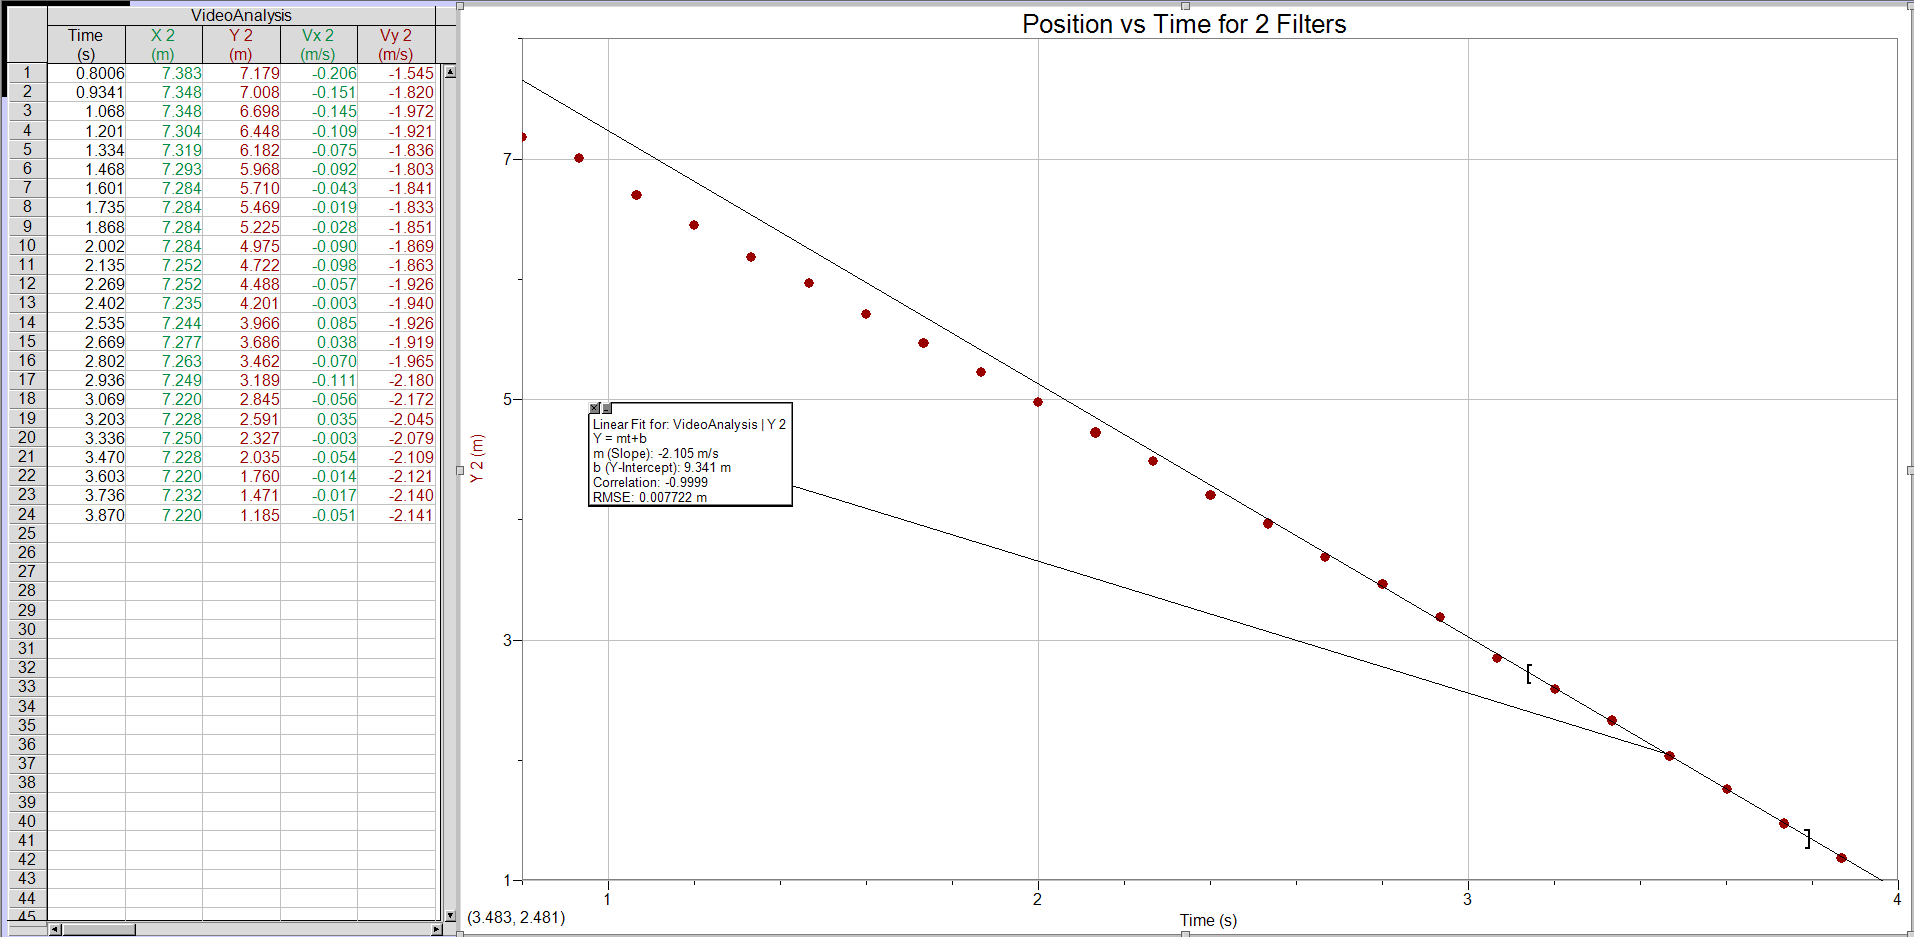
Here is an example of 1 of the filters dropped and the data points we created. We did this 5 times, once per video. The last few data points were analyzed, and their slope was taken, finding the terminal velocity.
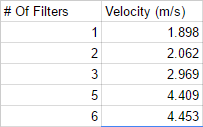
After doing the above for each amount of filters we came up with this data:
The next graph is how we determined our values of k and n. In the graph, A is equal to k, and B is equal to N. For our data, k=.00044+-.00013, and N=1.632+-.21.
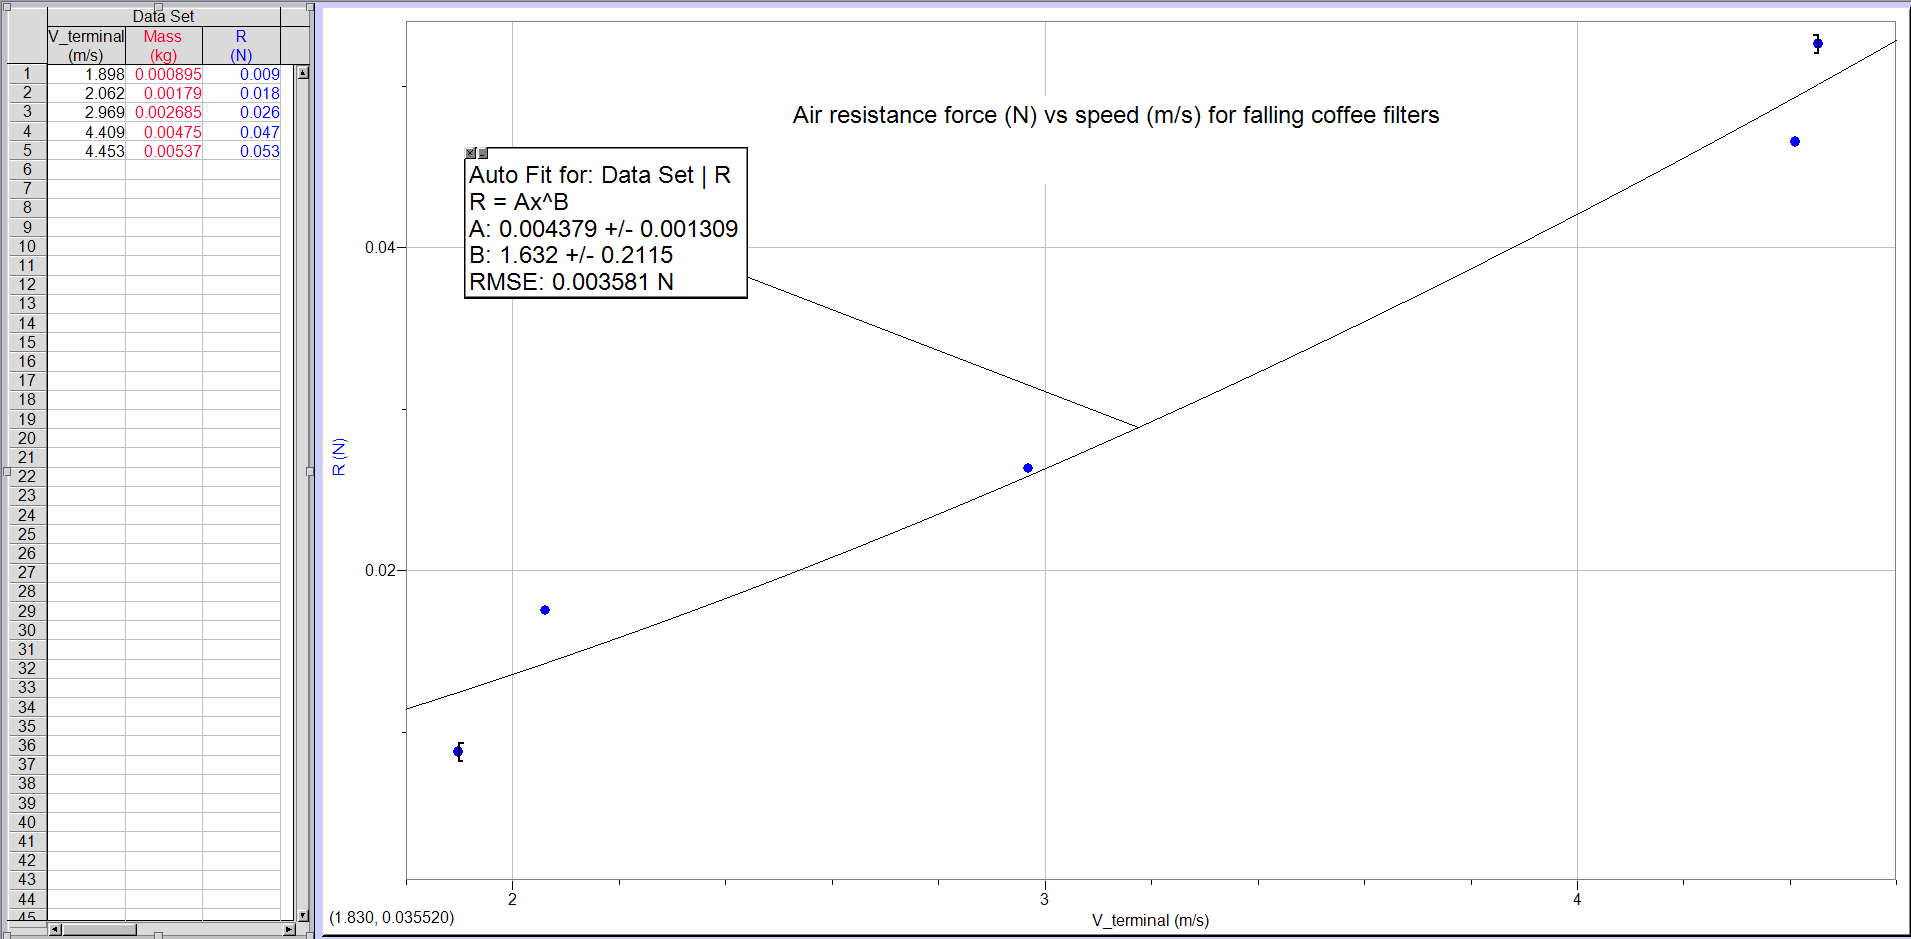
We determined the N and k values by using an auto fit for the N v V graph above, and using a power fit.
Part 2 Data:
This is the Excel data that was found after setup, and plugging in the numbers from our part 1 equation. The data is for the weight of 1 filter, and time interval at 1/30 seconds, but can easily be changed to how ever many coffee filters are wanted.
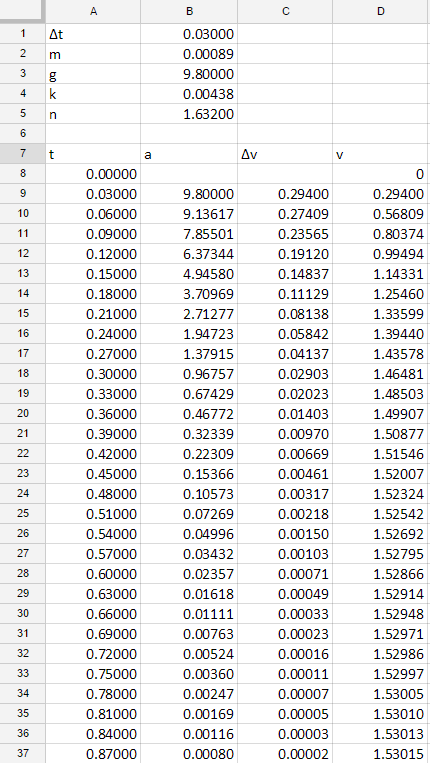
Our model for air resistance worked well but not perfect. Our actual value for V of 1 filter should have been 1.898 m/s.
Conclusions:
This experiment was surprisingly successful and accurate. I incorrectly guessed that the data points would be off by quite a lot and affect the rest of the labs data. Some of the error in the lab could have come from the inaccuracies in the Logger Pro points we inputted, as we can only record at 30 frames per second, and put 1 or less data points every 1.30th of a second. Our equation that we used to model our air resistance was just that, a model. It was never going to be fully accurate in any case.
No comments:
Post a Comment