Lab 13: Magnetic Potential Energy
Lab Members:
Jarrod Griffin
Christina Vides
Alex Reyes
This lab will help us model the force of Magnetic Potential Energy.
Introduction:
In this lab, we use an air-track glider and two magnets to prove that the conservation of energy theorem still applies to Magnetic Potential Energy. We accomplished this by doing this lab in 2 parts as will be discussed in the next section.
Apparatus/Procedure:
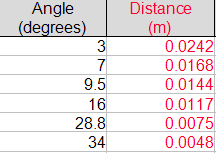
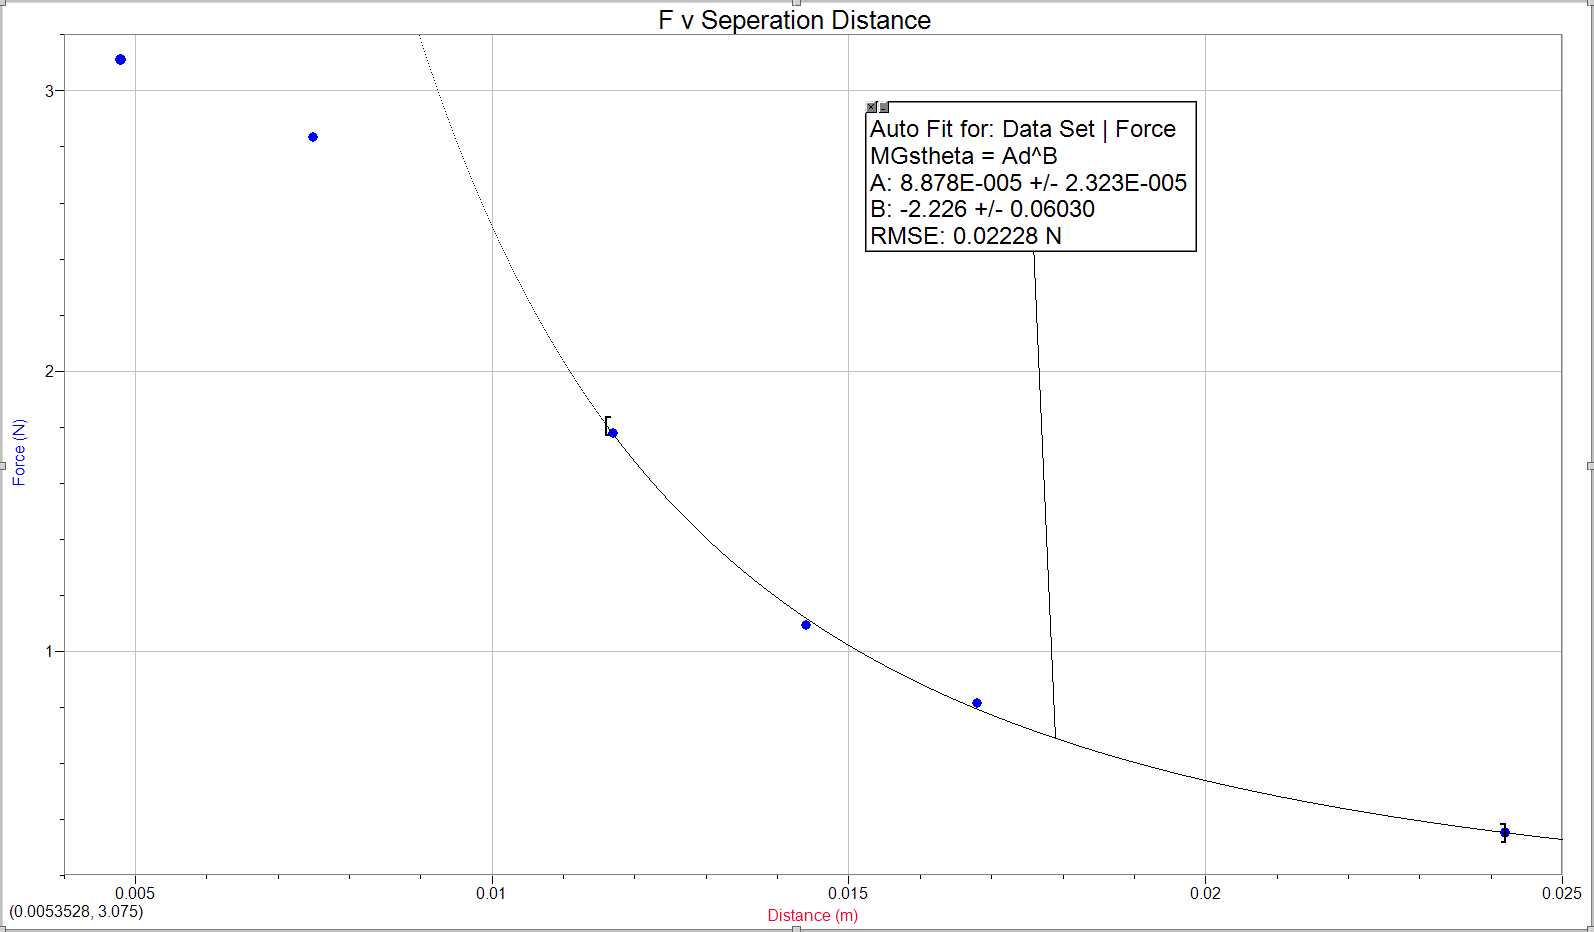
For the first part of this lab, we set up an air track on an angled surface, measured the angle the track was at, and then turned the track on with the cart so that the cart would more towards the magnet. Once it arrived at the magnet we allowed the cart to settle, and then we measured how far the cart was away from the other magnet. We then repeated this with different angles 6 times. Once this was done, we then found the magnetic force that was applied to the cart. Then we graphed the force vs the separation distance. From that graph, we could use Logger Pro's power fit option and received an equation U(r) for the interaction between the magnets. Our measurements were within .01 mm from the calipers, and in Logger Pro, A's uncertainty in the equation was +-2.322e-05, and B's was +-0.06026. Once that was done, we then set up the second part of the lab. In the second part we placed the track and cart on a level surface, and placed a motion sensor at the end of the track, but far enough away that the motion sensor will still be able to 'see' the cart at all times. We then pushed the cart along the track and recorded the data of the carts position. We then determined the relationship between the distance the motion detector reads and the separation distance between the magnets, as described in the lab manual.

Measured Data:
For our separation distance, we measured .33 meters.
Calculated Data:
Conclusion:
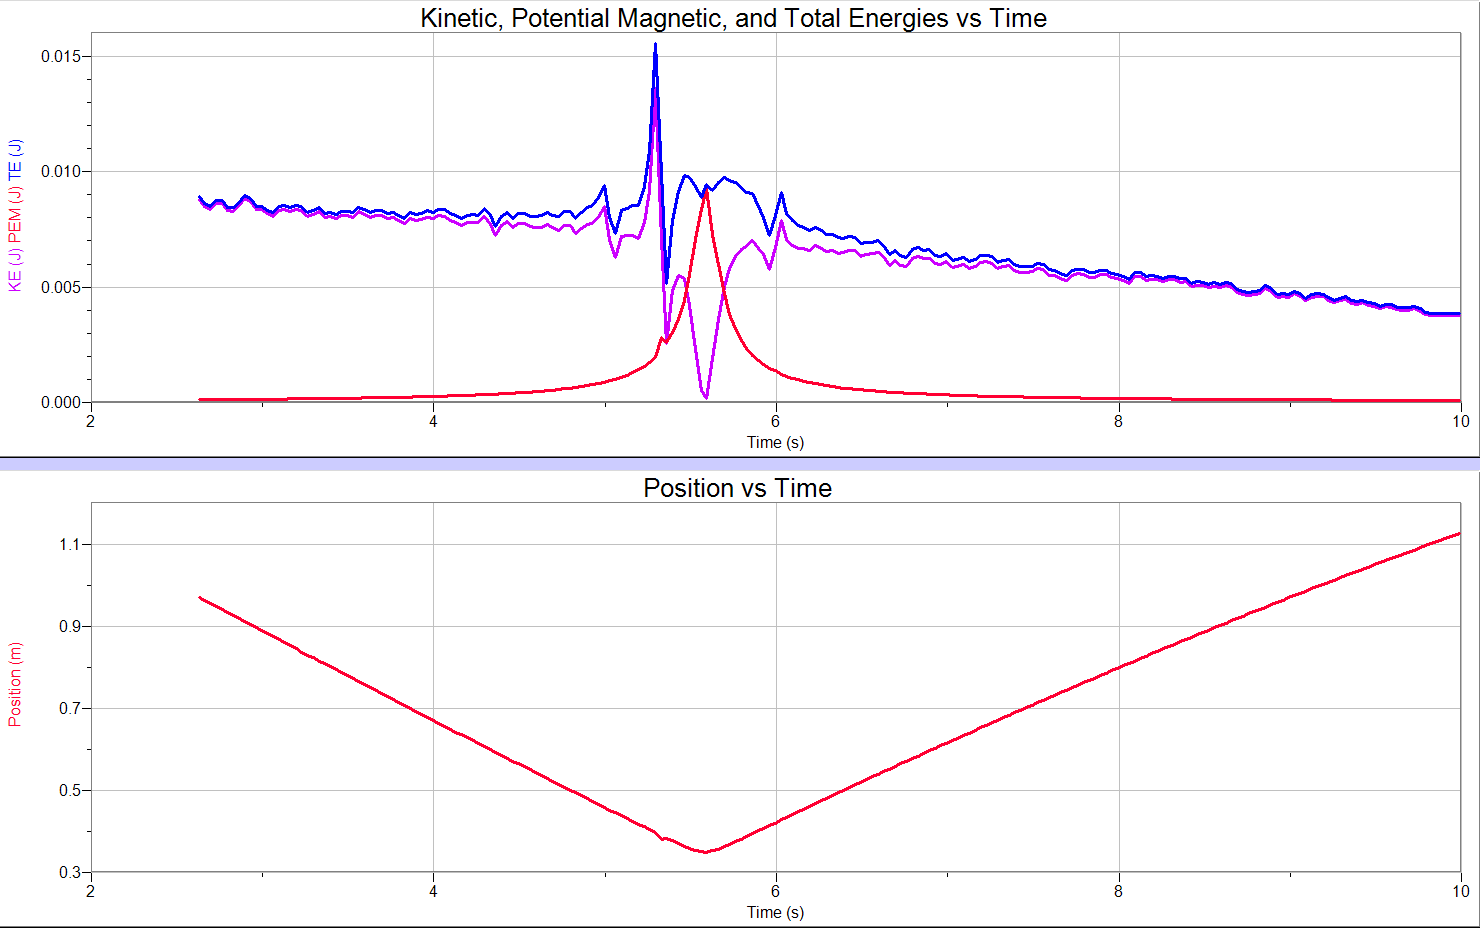
This lab turned out well, with only a few bad points of data that were causing us issues. In the Force vs Separation graph, once the first two data points were taken away, our power fit was excellent. In our Energy vs Time graph, we had an issue of a small blip in our position data, creating the bad looking graph shown above. We also had an issue when determining our separation distance.
This lab will help us model the force of Magnetic Potential Energy.
Introduction:
In this lab, we use an air-track glider and two magnets to prove that the conservation of energy theorem still applies to Magnetic Potential Energy. We accomplished this by doing this lab in 2 parts as will be discussed in the next section.
Apparatus/Procedure:
For the first part of this lab, we set up an air track on an angled surface, measured the angle the track was at, and then turned the track on with the cart so that the cart would more towards the magnet. Once it arrived at the magnet we allowed the cart to settle, and then we measured how far the cart was away from the other magnet. We then repeated this with different angles 6 times. Once this was done, we then found the magnetic force that was applied to the cart. Then we graphed the force vs the separation distance. From that graph, we could use Logger Pro's power fit option and received an equation U(r) for the interaction between the magnets. Our measurements were within .01 mm from the calipers, and in Logger Pro, A's uncertainty in the equation was +-2.322e-05, and B's was +-0.06026. Once that was done, we then set up the second part of the lab. In the second part we placed the track and cart on a level surface, and placed a motion sensor at the end of the track, but far enough away that the motion sensor will still be able to 'see' the cart at all times. We then pushed the cart along the track and recorded the data of the carts position. We then determined the relationship between the distance the motion detector reads and the separation distance between the magnets, as described in the lab manual.
Measured Data:
For our separation distance, we measured .33 meters.
Calculated Data:
Conclusion:
This lab turned out well, with only a few bad points of data that were causing us issues. In the Force vs Separation graph, once the first two data points were taken away, our power fit was excellent. In our Energy vs Time graph, we had an issue of a small blip in our position data, creating the bad looking graph shown above. We also had an issue when determining our separation distance.
No comments:
Post a Comment