Lab Members:
Jarrod Griffin
Christina Vides
Enio Rodriquez
In this lab, we predict how Kinetic Energy, Gravitational and Elastic Potential energy will appear on a graph vs time, and then compare that to actual values we get from doing the experiment. We also check to see if the total energy of the system stays constant.
Introduction:
For this lab, we used a Mass-Spring System to prove that the conservation of energy theorem is true, and can be applied in real life events. Will also used this lab as a chance to test what we know about the above energies.
Apparatus/Procedure:
We set up our lab in accordance with the lab manual. We first measured the length and weighed the spring, and verified the weight of our mass. We then zeroed and reversed the distance sensors. We accomplished this by referring to the lab manual. We used a laptop and Logger Pro to record data. We changed the software, as described in the lab manual. The procedure for how each graph was made will be written below each graph in the data section of this write up. Below is a picture of our setup.

Graphs/Data:
My Predictions:
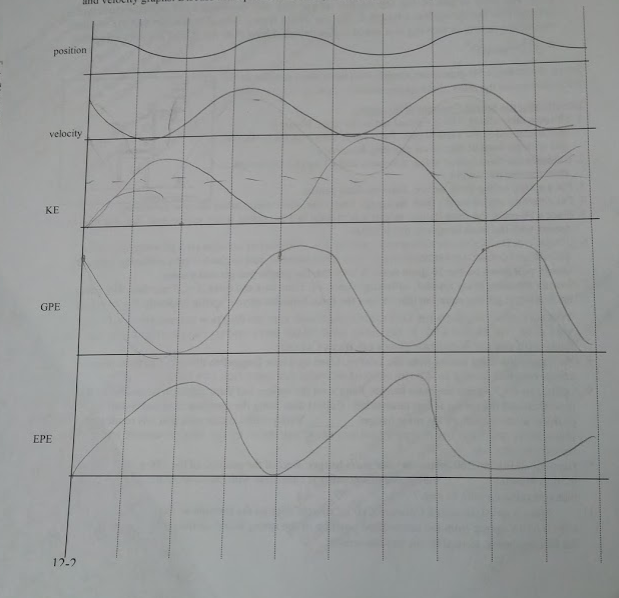
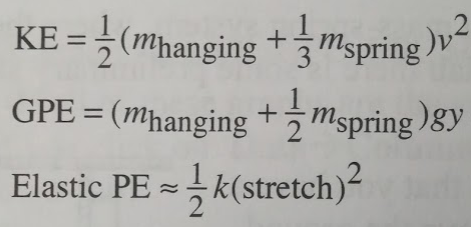
In order to find the above calculations, we created different columns for each energy, and used the formulas shown below to have Logger Pro calculate the data required for each energy.
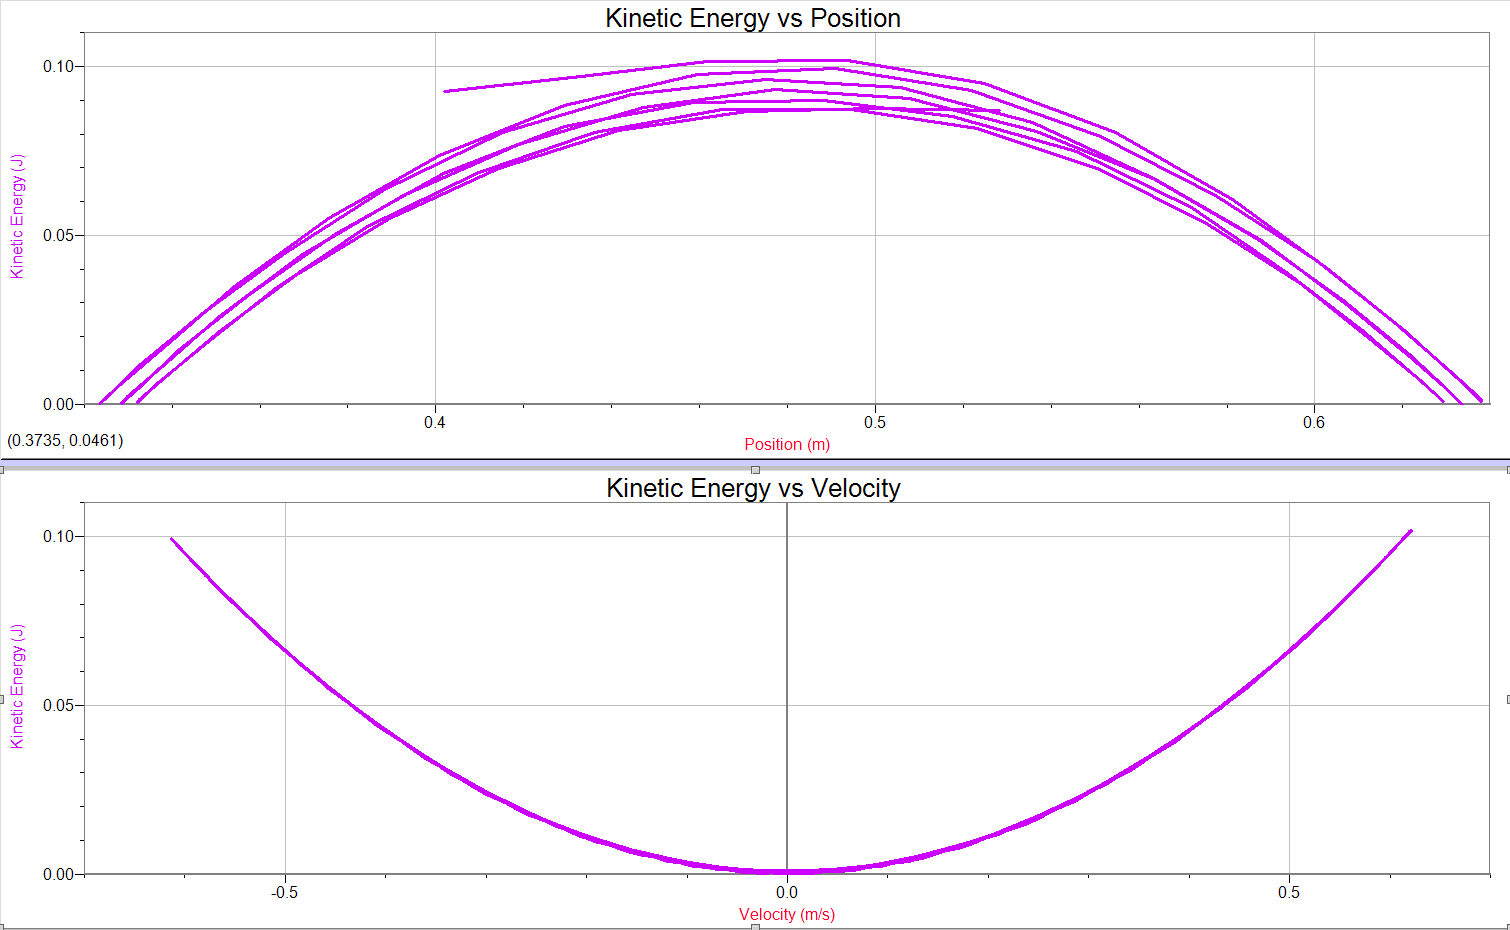
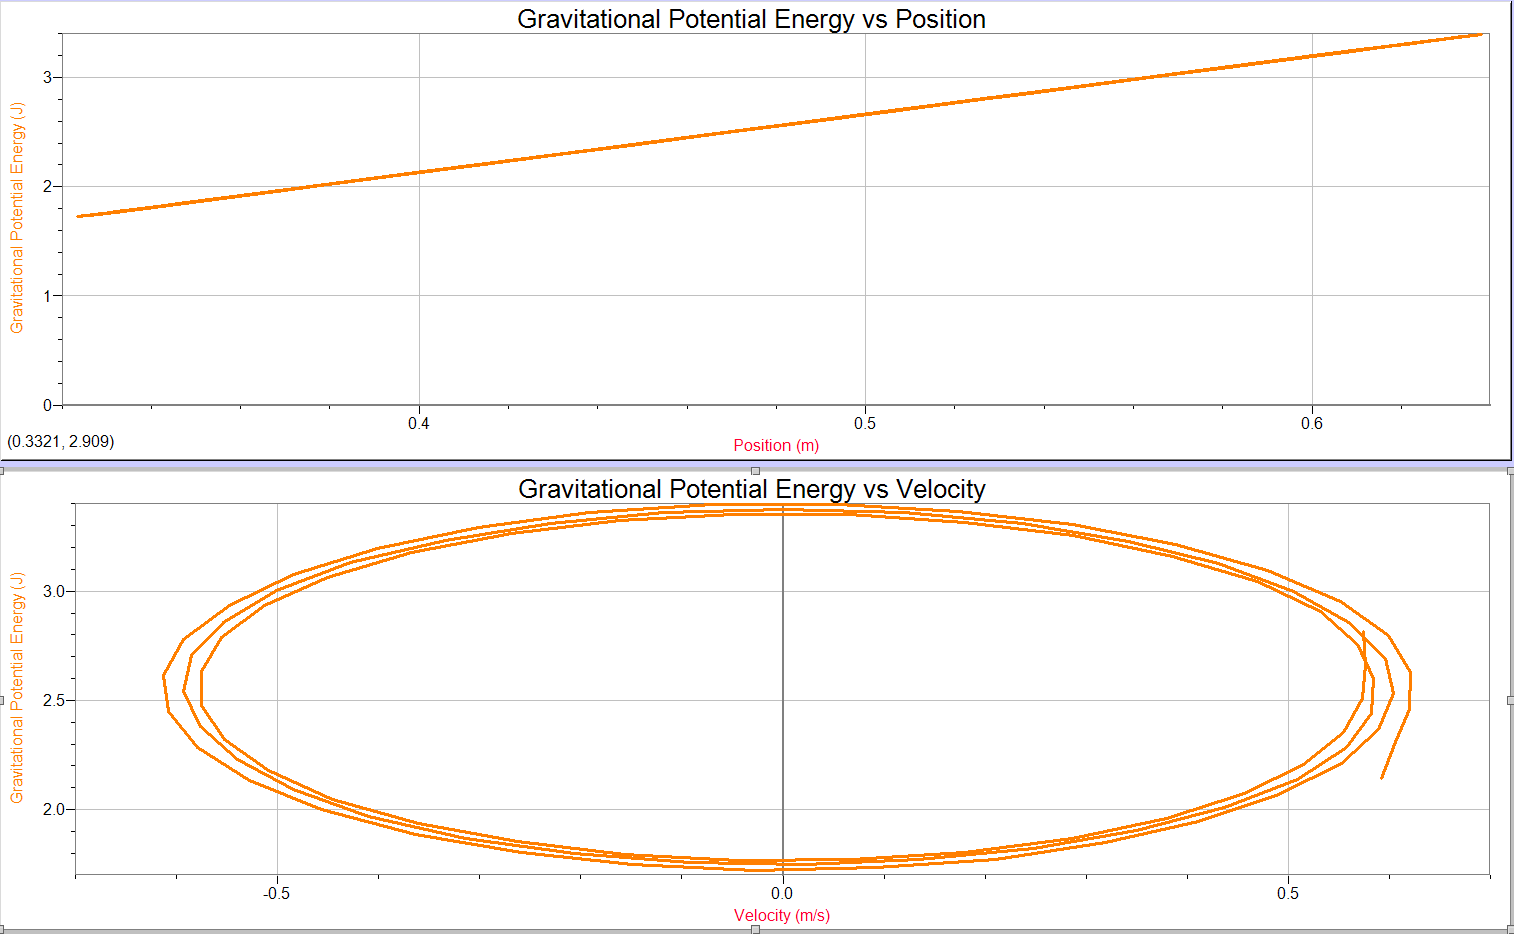
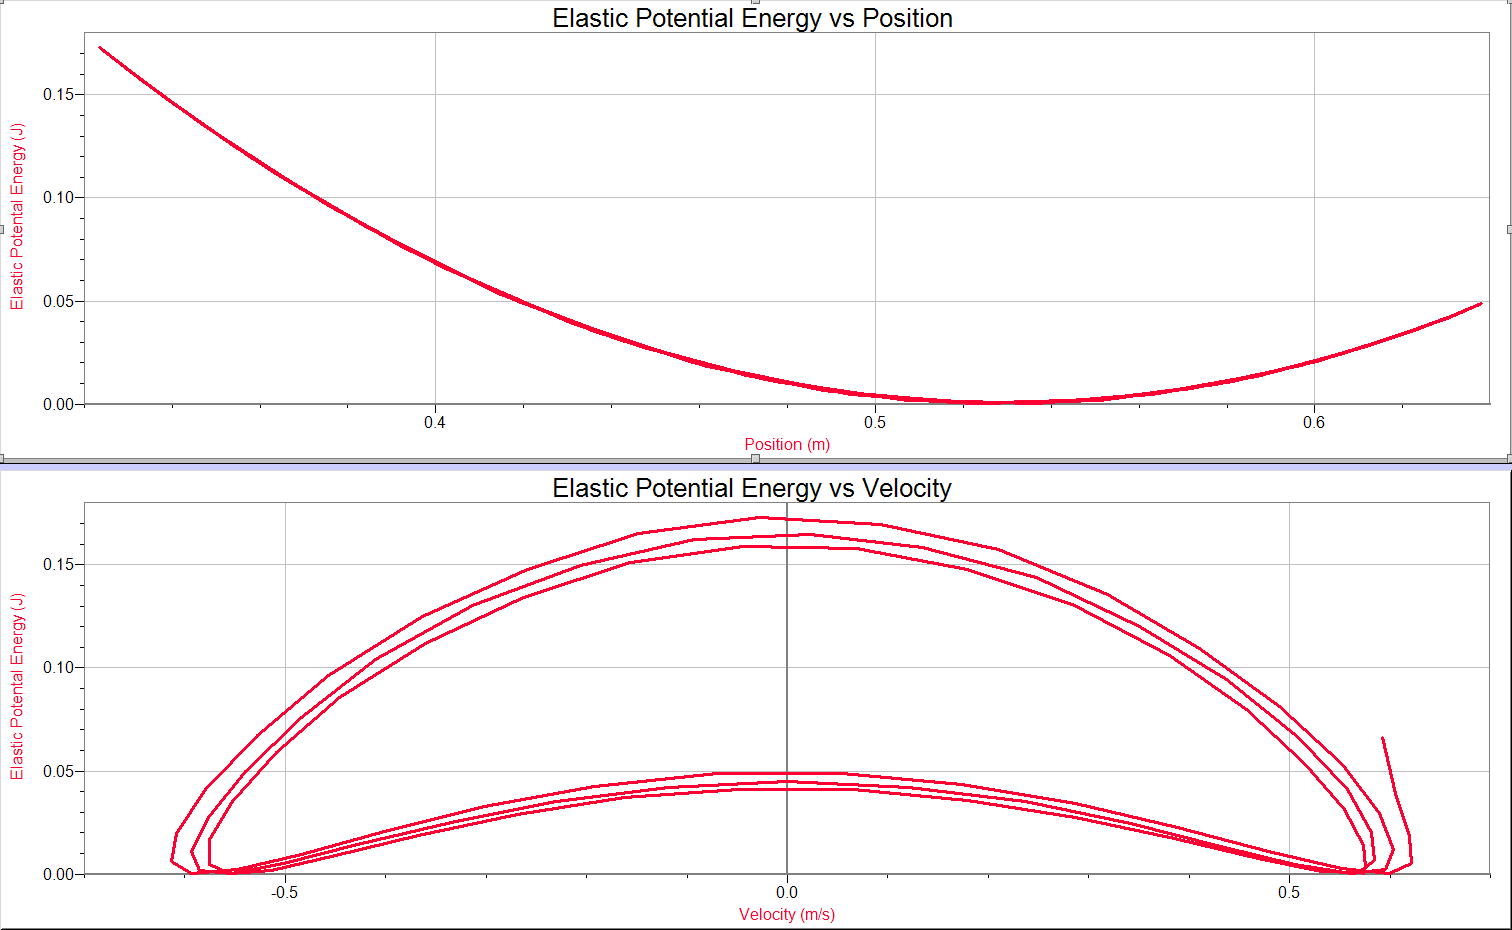
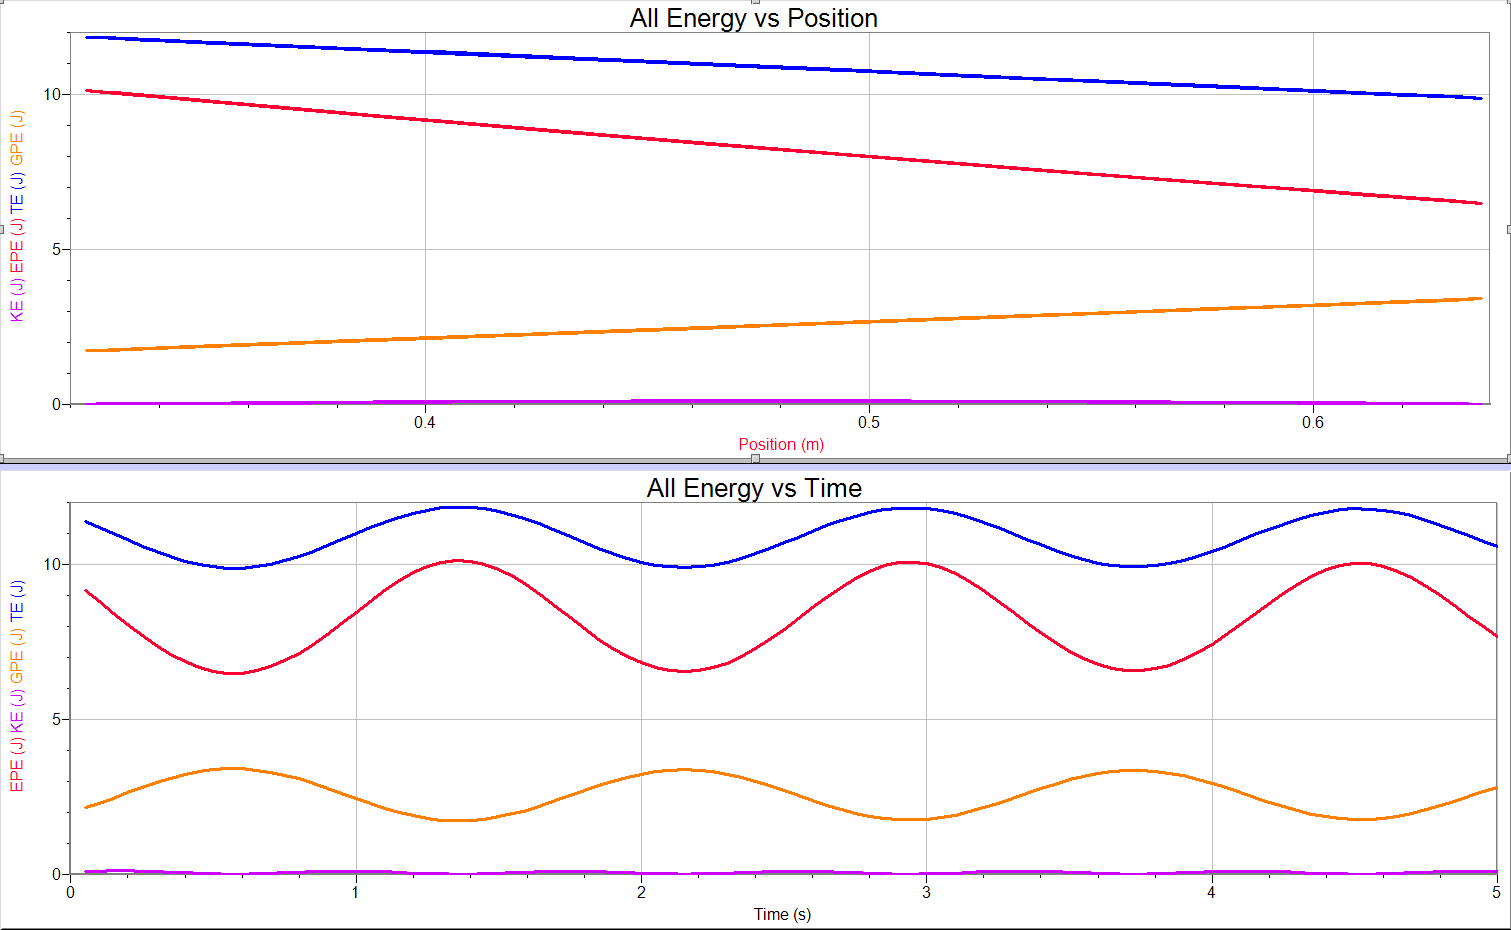
These graphs show where the energy in the system is going at different times and different positions. The blue time, total energy in the system, should stay constant in a perfect world, but as shown in the graph above it does not. It looses small amounts of energy due to outside sources. Our calculations were also not perfect, as the spring will not be perfectly constant throughout its stretch as they were not perfect springs.
Conclusion:
Only some of my predictions were shown as correct. Our data for this lab was actually very nice, and helped us in analyzing the data. This lab was very interesting, and having a visual representation of different energies helped me to understand them more. Each graph makes since, even if they are a bit off. In order to check if they make sense, we looked the the formulas of how each was calculated and plugged different points of data in for each, just to make sure they were close to correct.
No comments:
Post a Comment