Lab 11: Work-Kinetic Energy Theorem Activity
Lab Members:
Jarrod Griffin
Christina Vides
Enio Rodriquez
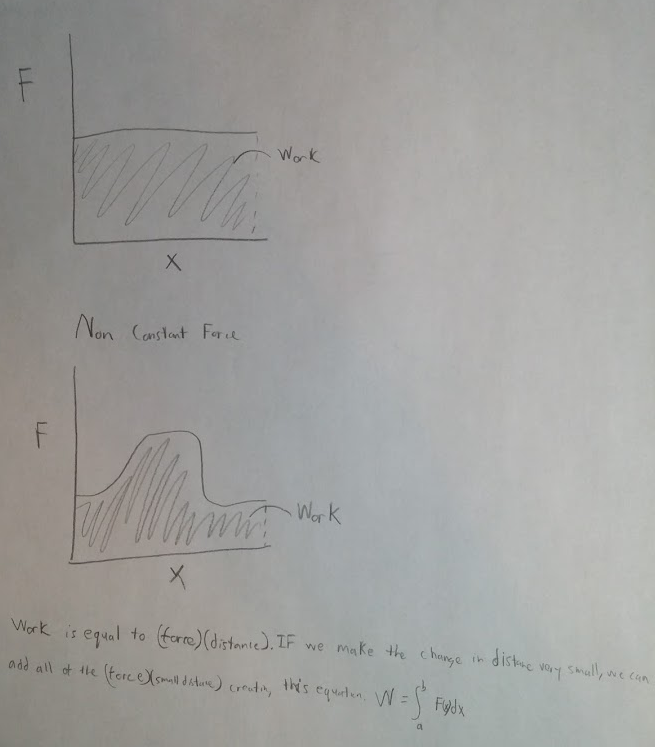
In this lab we will use the Work-Kinetic Energy Theorem to show that the area under a force curve will be equal to the Kinetic Energy at that point.
Introduction:
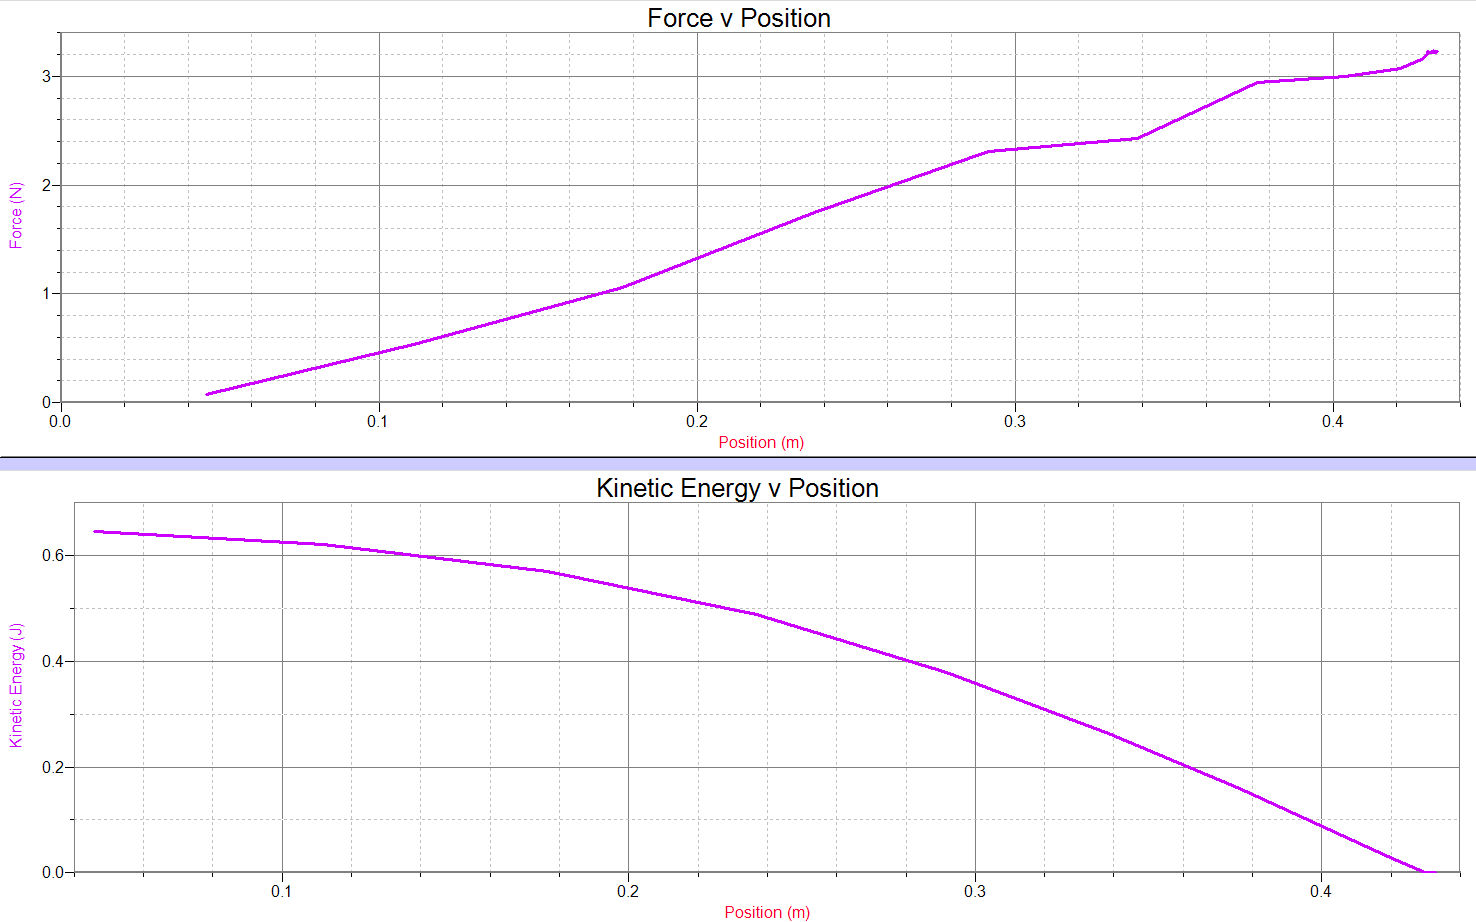
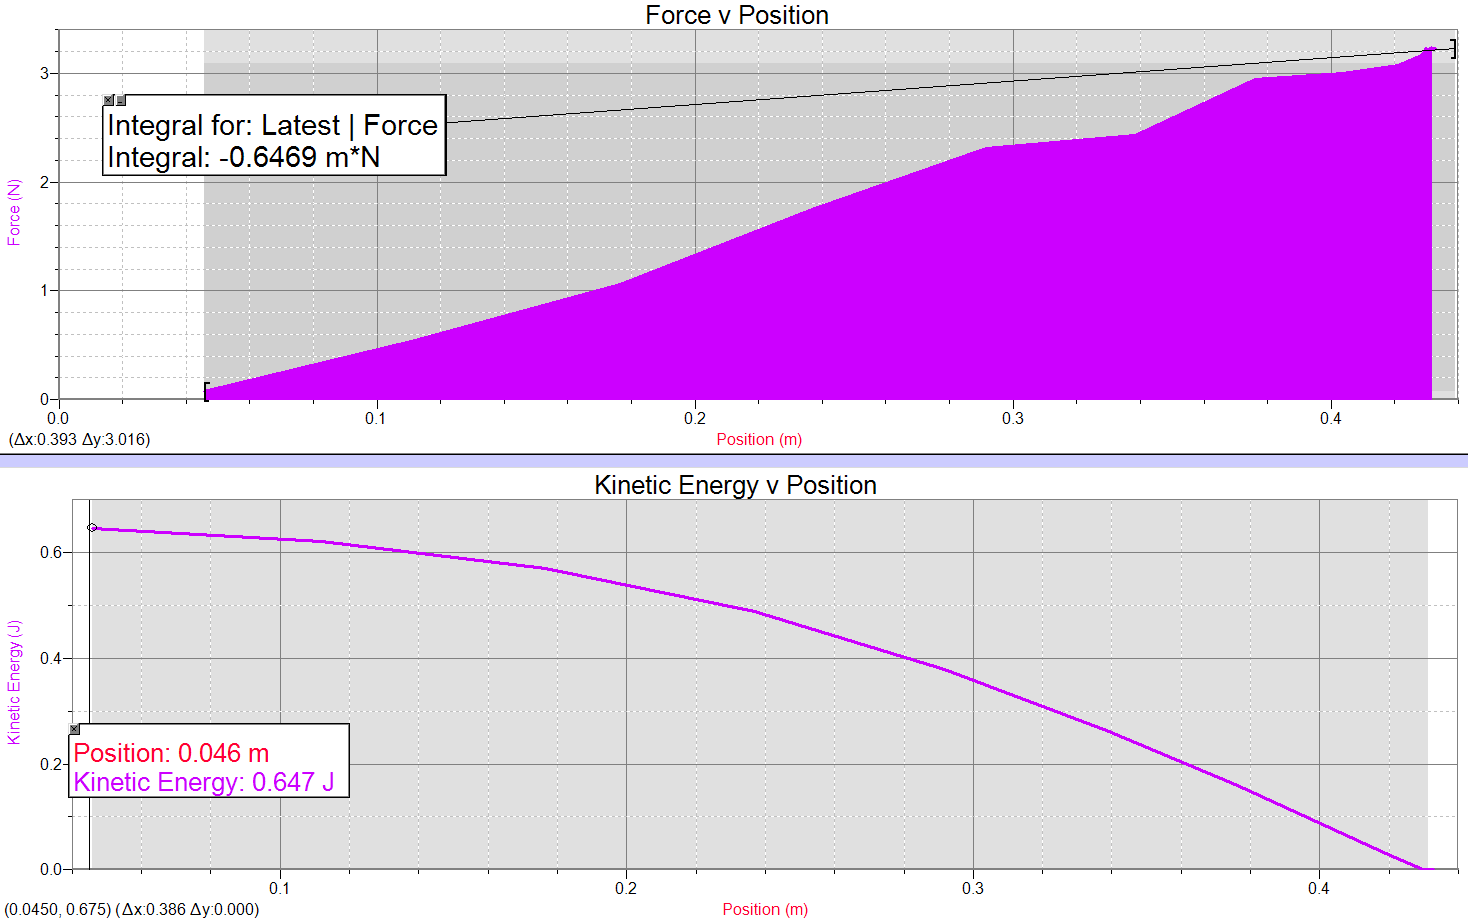
In this lab we used a motion and force sensor along with a cart and spring to show the relationship between Work and Kinetic Energy. Once we received a nice Force v Position graph, we calculated the kinetic energy, and compared the two graphs side by side, and then proved our theory by taking the area under the Force v Position graph.
Apparatus/Procedure:
We set up our apparatus as described in the lab manual, with a cart attached to a spring, and placed on a cart track with a motion sensor and force sensor attached. This set up is shown below. Our setup did not change between the two experiments.

Once we set up our experiment we followed the procedure outlined in the lab manual. We first calibrated our force and motion sensors. We then opened the Logger Pro file on our computers. We then ran an experiment where we moved the cart closer to the motion sensor in order to get a force v position graph. For our second experiment, we stretched the spring and cart system some distance away from the resting point. We recorded the data in Logger Pro and created a calculated Kinetic Energy column.
Data/Graphs:
Conclusions:
The work done on the cart by the spring should be equal to the maximum kinetic energy in the cart. Our data above shows that this is true. While not equaling perfectly, they are very close for this experiment.
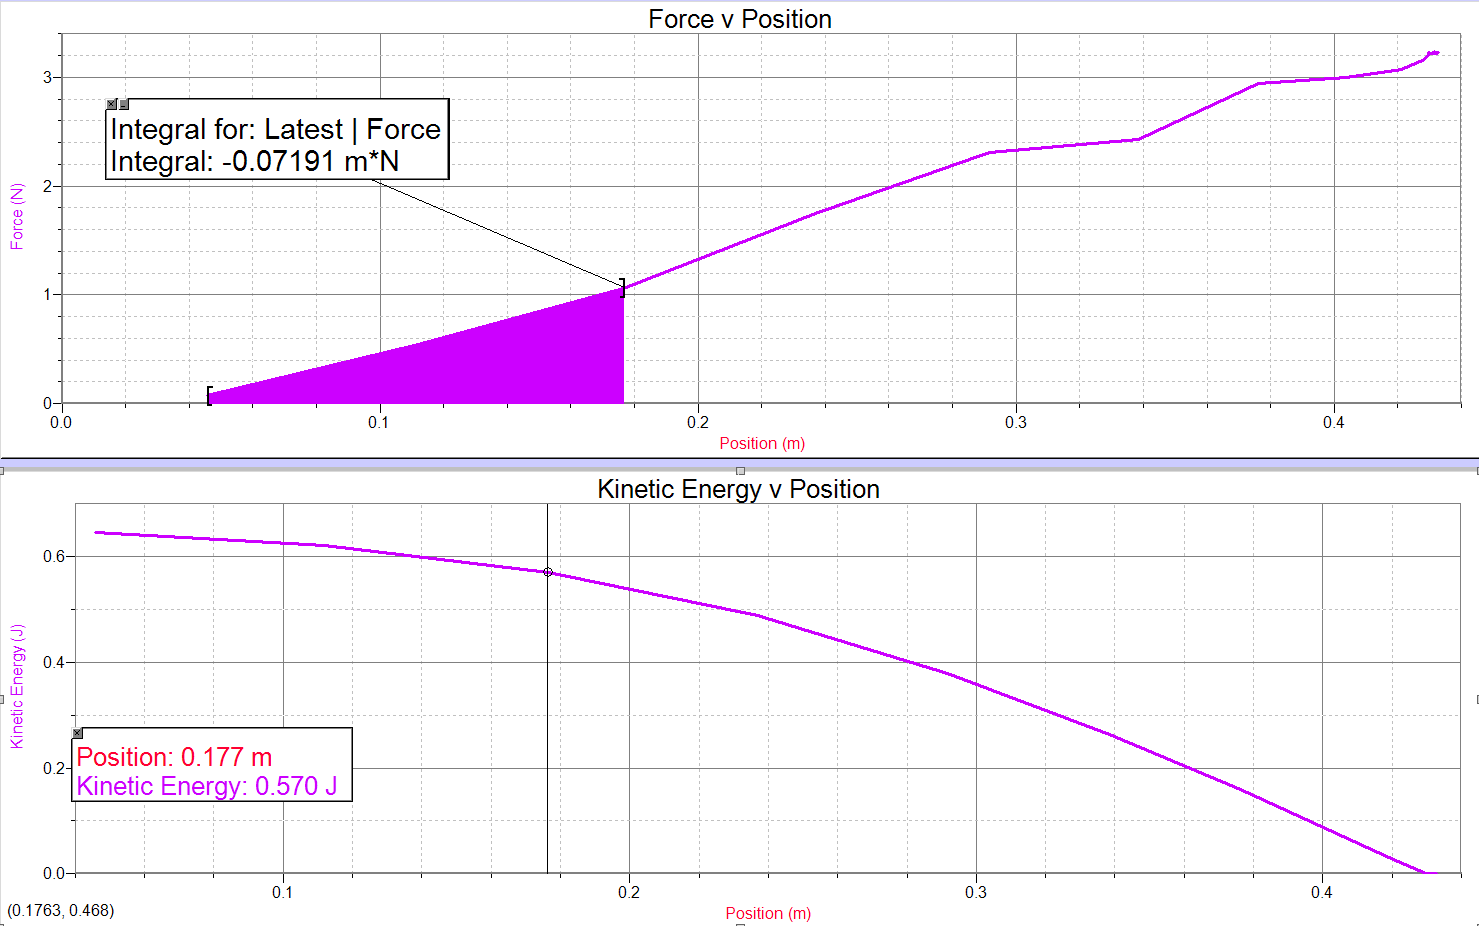
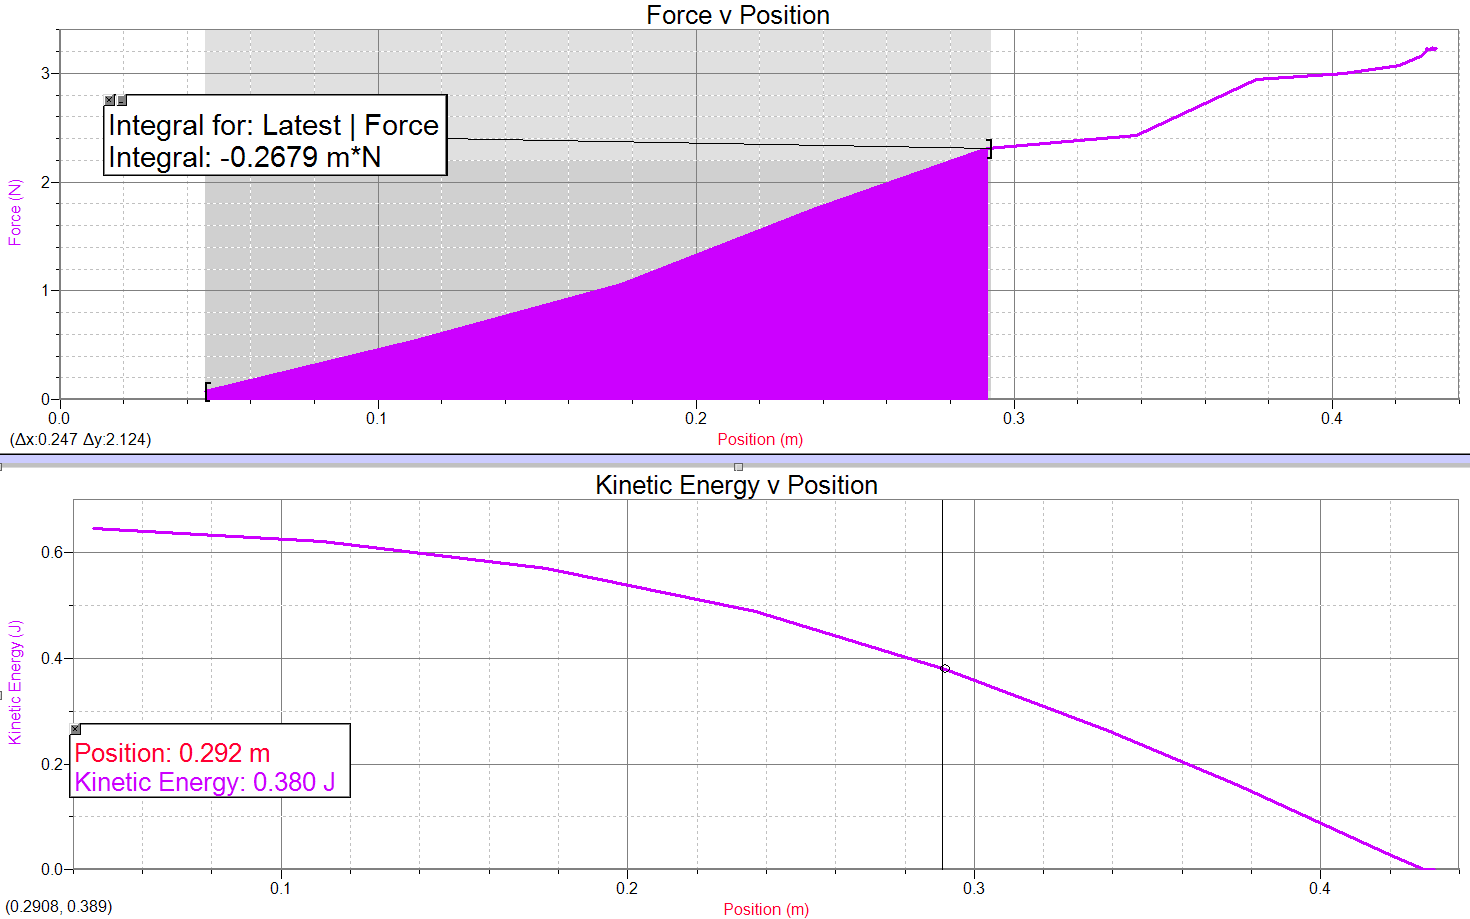
Work is equal to the force times the distance. Work is also equal to the change in kinetic energy. If we find the change in kinetic energy, that value should be equal to the area under the curve up until that point. This is proven by taking the integral of the first graph and comparing it to the maximum value of the second graph.
No comments:
Post a Comment