Lab 21: Mass-Spring Oscillations Lab
Date Completed: November 23rd 2016
Lab Members:
Jarrod Griffin
Christina Vides
Enio Rodriquez
Introduction:
In this lab, we worked as a team of smaller groups, each with one spring. We found spring constants and masses, then found the period of the spring with various masses, then compared our data with the class. This lab used our knowledge of springs and periods to calculate various data points.
Procedure/Apparatus:
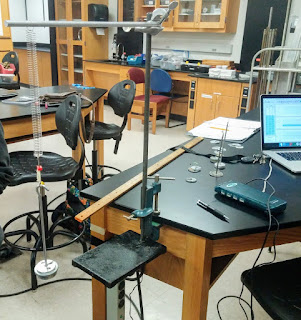
We initially were assigned one spring. We measured the weight of the spring and then used the effective mass formula provided in the lab manual to calculate the effective mass of the spring. One we determined that, we found the spring constant by measuring the length of spring before mass was applied, and then after mass was applied. We used those values in the F=kx formula. Once that constant was found we found the oscillation periods for 5 various masses and recorded them. We then plugged the data into Logger Pro to analyze. Below is a picture of our apparatus that we set up as described in the lab manual.
Measured Data:
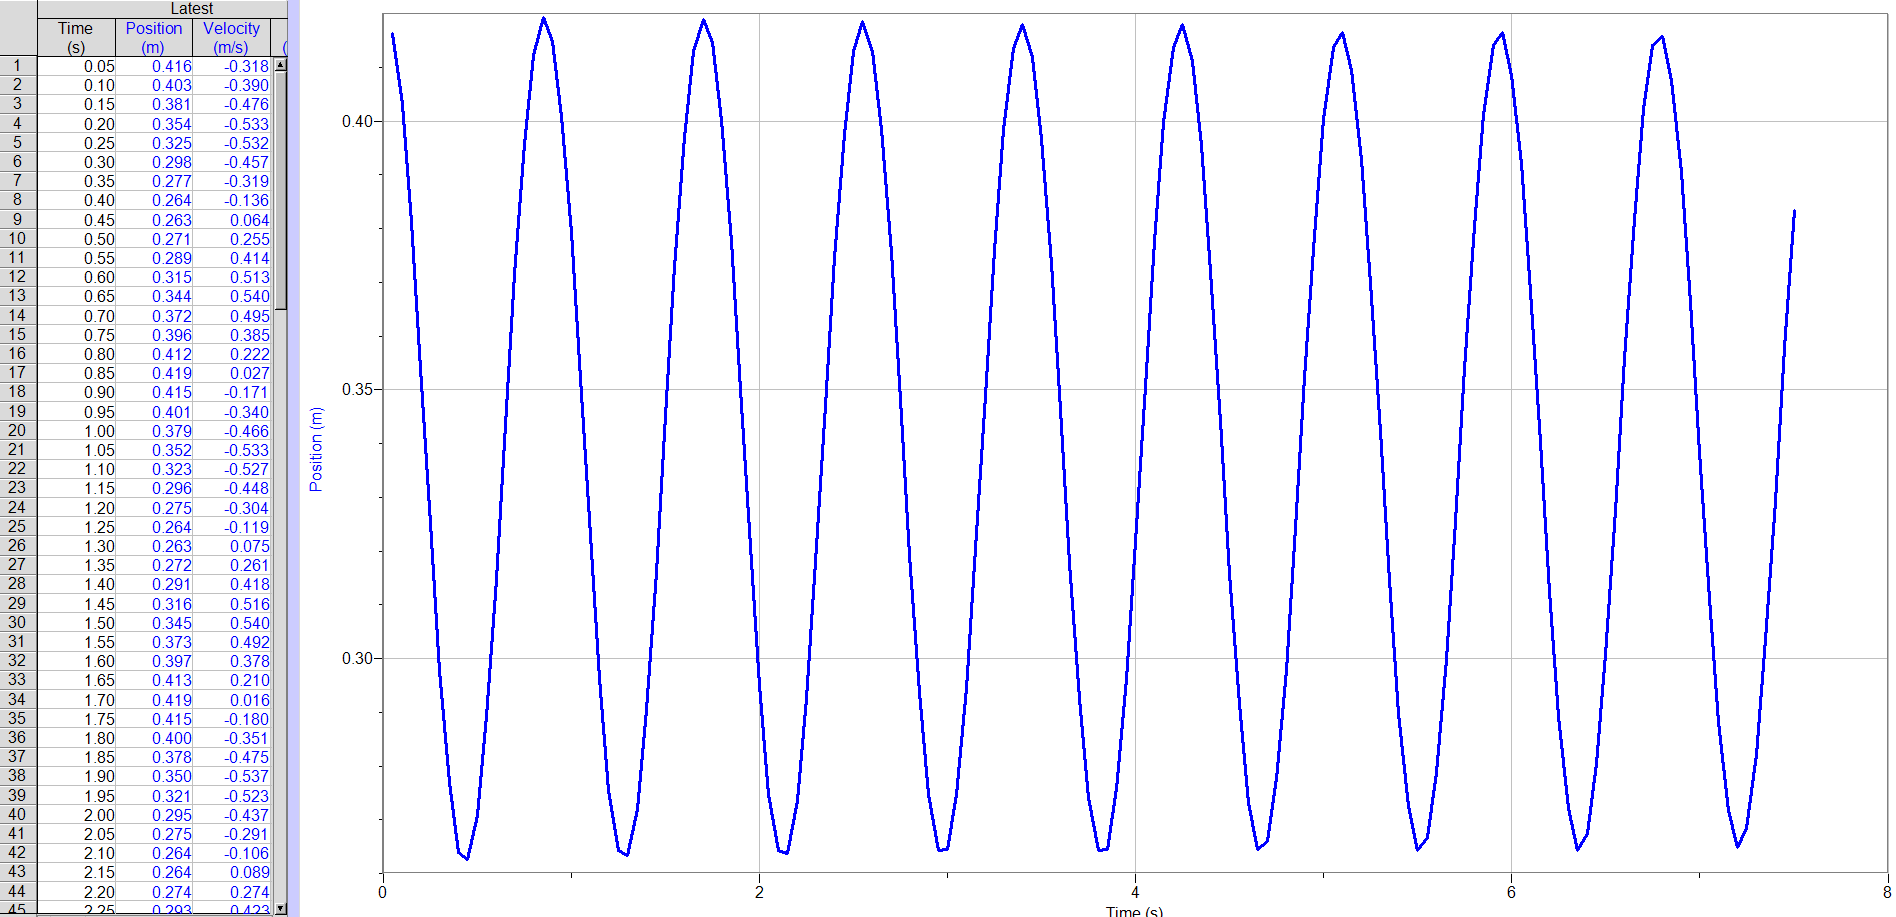
We measured the period of the spring with various masses by using Logger Pro. We could find the time between two peaks of the position, then measure out 10 of them and take an average of the time between two peaks. Below is an example of the Logger Pro graph we used.
We also took measurements of various masses, included in the spreadsheet are our period data points.
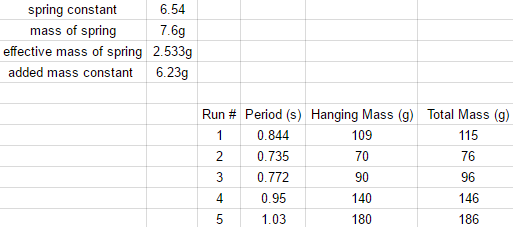
We also collaborated with the class in order to get spring constants and masses for the other springs.

Calculated Data:
In order to calculate our theoretical values for period of the spring and different masses we used the equation 2𝜋√(m/k)=T.

Below is our graph of Period vs Hanging Mass. We checked to see if our data was accurate by using a curve fit and checking how well our data lined up. We used the T=Ax^0.5 power fit as shown below.
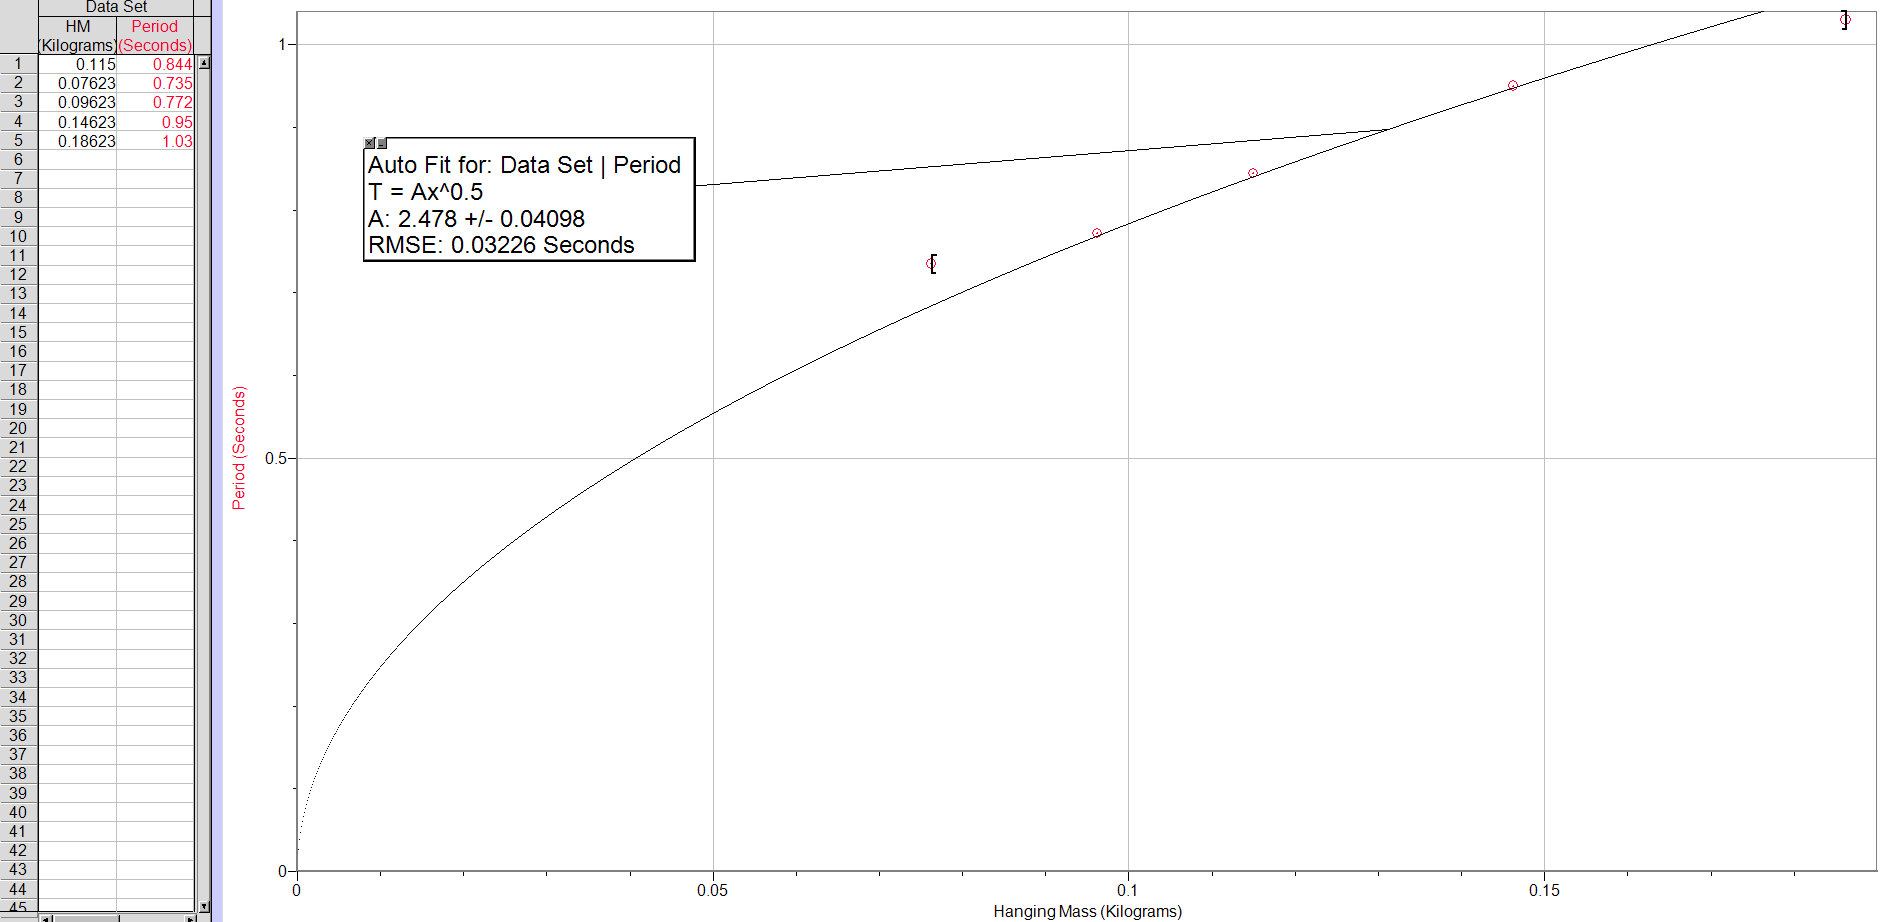
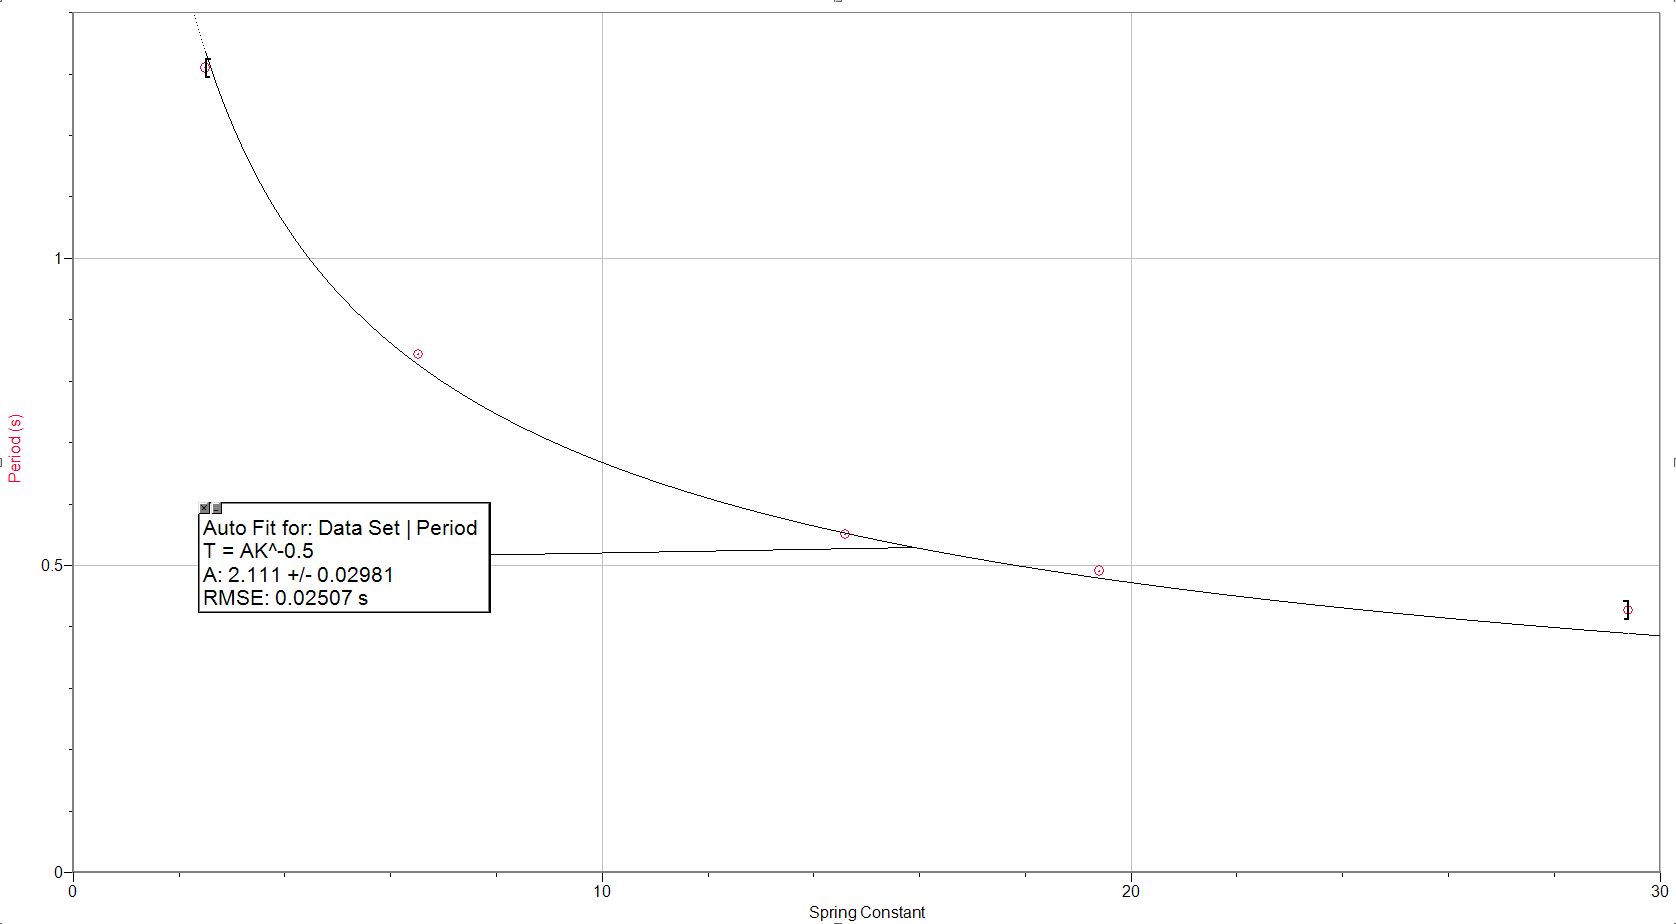
Our data fit very well, except for one data point. We then graphed the class periods vs their spring constant values. We used the same curve fit function for that data as shown below and discovered it fit well, just like our other graph with no majorly different data points.
Conclusion:
Our percent errors were very small for this lab. Springs and oscillations work well as there is little friction and other outside forces working on it. One issue is that not all springs are perfect, although ours were very close.
5. If our k value was off by 5%, if would effect the period calculations by around 3.5%.
6. If the spring constant would increase, the spring would become stiffer, and also requires more force to stretch the spring. The spring will be slow to stretch with the same amount of mass as before. The spring force will be stronger, meaning a weaker effective downward acceleration from gravity, and slowing the mass, therefor slowing the period.
7. If the mass of the system increases, then so does the force due to gravity. More mass also means more stretch in the spring, meaning that the spring force will also increase. When both forces increase, the acceleration down and up will increase, reducing the time to complete a cycle up and down and up, making the period smaller.
No comments:
Post a Comment